Introduction
Network Monitoring Tools are platforms designed to observe, analyze, and optimize the performance, availability, and security of IT networks. These tools provide real-time insights into network traffic, device status, bandwidth utilization, and potential issues, enabling IT teams to proactively manage network health. By identifying bottlenecks, anomalies, or failures before they impact users, organizations can ensure reliable connectivity, minimize downtime, and maintain operational efficiency.
In as enterprises adopt hybrid cloud environments, remote work infrastructures, and IoT devices, robust network monitoring has become essential. Real-world use cases include monitoring WAN/LAN performance, detecting anomalies or security breaches, tracking bandwidth utilization, managing cloud network resources, and supporting SLA compliance for service providers. Buyers evaluating network monitoring tools should consider alerting and automation, scalability, AI/analytics features, device coverage, reporting capabilities, integration with ITSM platforms, ease of deployment, and cost efficiency.
Best for: IT operations teams, network engineers, SRE teams, large-scale enterprises, managed service providers.
Not ideal for: Small organizations with minimal network complexity or static environments where manual monitoring suffices.
Key evaluation criteria include:
- Real-time network performance monitoring
- AI-driven anomaly detection
- Scalability for enterprise and multi-site environments
- Integration with ITSM, cloud, and security platforms
- Automated alerting and incident workflows
- Historical analytics and reporting
- Multi-protocol and device support
- Ease of deployment and configuration
- Security and compliance features
- Pricing and total cost of ownership
Key Trends in Network Monitoring Tools
- AI-driven anomaly detection and predictive analytics
- Automated alerting and remediation workflows
- Integration with AIOps, ITSM, and observability platforms
- Multi-cloud and hybrid network monitoring
- Low-code workflow automation for incident handling
- Enhanced visualization and real-time dashboards
- Network traffic encryption and security monitoring
- Subscription and usage-based pricing models
- IoT and remote device monitoring
- Compliance-ready reporting and audit trails
How We Selected These Tools (Methodology)
- Assessed market adoption and industry recognition
- Evaluated feature completeness, including AI and automation
- Measured performance and reliability in enterprise networks
- Reviewed security posture and compliance capabilities
- Examined integration ecosystem with monitoring, ITSM, and cloud platforms
- Considered scalability across multi-site and hybrid networks
- Evaluated ease of setup and usability
- Assessed reporting and analytics capabilities
- Reviewed vendor support, documentation, and community engagement
- Balanced cost versus value for SMB and enterprise organizations
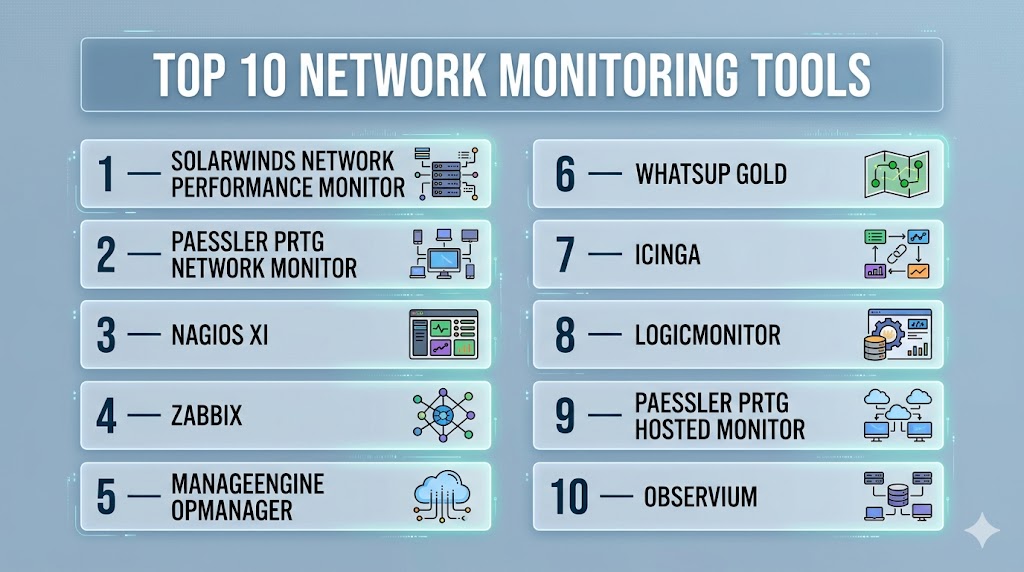
Top 10 Network Monitoring Tools
#1 — SolarWinds Network Performance Monitor
Short description : SolarWinds Network Performance Monitor provides comprehensive network monitoring, fault detection, and performance analytics for enterprise networks and service providers.
Key Features
- Real-time network performance monitoring
- Automated alerts and thresholds
- Multi-vendor device support
- Traffic analysis and bandwidth monitoring
- Customizable dashboards and reporting
- Integration with ITSM tools
Pros
- Broad device and protocol coverage
- Scalable for large networks
- Robust alerting and visualization
Cons
- Enterprise pricing
- Complex initial setup
- Learning curve for advanced analytics
Platforms / Deployment
- Web, Windows
- On-premises / Hybrid
Security & Compliance
- SOC 2, ISO 27001
- SSO, MFA, encryption
Integrations & Ecosystem
- ITSM: ServiceNow, Jira
- Cloud monitoring: AWS, Azure
- APIs for custom reporting and automation
Support & Community
Enterprise support, extensive documentation, active user community.
#2 — Paessler PRTG Network Monitor
Short description : PRTG monitors network devices, traffic, and applications, providing real-time analytics and automated alerting for IT teams of all sizes.
Key Features
- SNMP, NetFlow, and packet sniffing support
- Real-time network dashboards
- Automated alerting and notifications
- Customizable sensors for devices and services
- Reporting and historical analytics
- Integration with ITSM and cloud services
Pros
- Easy setup and intuitive dashboards
- Scalable with flexible licensing
- Wide range of monitoring protocols
Cons
- High number of sensors may increase cost
- Limited AI features compared to enterprise platforms
- Cloud integrations may require additional setup
Platforms / Deployment
- Windows, Web
- On-premises / Hybrid
Security & Compliance
- Encryption, SSO
- Not publicly stated
Integrations & Ecosystem
- Cloud platforms: AWS, Azure
- ITSM: ServiceNow, Jira
- APIs for automation
Support & Community
Professional support, knowledge base, and community forums.
#3 — Nagios XI
Short description : Nagios XI is an enterprise-grade network and server monitoring platform that provides alerting, performance monitoring, and predictive analytics for hybrid IT environments.
Key Features
- Multi-device and multi-platform monitoring
- Customizable alerting and notifications
- Performance graphs and dashboards
- Historical data reporting
- Plugin ecosystem for extended functionality
- ITSM integrations
Pros
- Open-source and flexible
- Scalable for enterprise environments
- Active plugin community
Cons
- Steep learning curve
- Requires technical expertise for customization
- Cloud integrations may be limited
Platforms / Deployment
- Windows, Linux, Web
- Self-hosted / Hybrid
Security & Compliance
- Encryption, RBAC
- Not publicly stated
Integrations & Ecosystem
- ITSM: ServiceNow, Jira
- Monitoring plugins for databases, applications
- APIs for custom integrations
Support & Community
Enterprise support, extensive documentation, and active community forums.
#4 — Zabbix
Short description : Zabbix is an open-source network monitoring tool that provides real-time monitoring, alerting, and visualization for complex IT infrastructures.
Key Features
- Multi-device and protocol support
- Real-time dashboards
- Automated alerts and triggers
- Historical data storage and analytics
- Low-code workflow automation
- API access for custom integrations
Pros
- Open-source and highly customizable
- Scalable for large networks
- Strong community support
Cons
- Technical expertise required
- Initial configuration can be complex
- Limited out-of-the-box cloud features
Platforms / Deployment
- Windows, Linux, Web
- Self-hosted / Hybrid
Security & Compliance
- Encryption, SSO
- Not publicly stated
Integrations & Ecosystem
- Cloud platforms: AWS, Azure
- ITSM: ServiceNow, Jira
- APIs and webhooks for automation
Support & Community
Community-driven support and enterprise options for professional support.
#5 — ManageEngine OpManager
Short description : OpManager offers real-time network monitoring, bandwidth analysis, and alerting to optimize IT network performance.
Key Features
- Network performance monitoring
- Automated alerting and notifications
- Traffic analysis and reporting
- Multi-vendor device support
- Customizable dashboards
- Integration with ITSM and cloud services
Pros
- Intuitive UI and dashboards
- Quick deployment
- Broad protocol support
Cons
- Limited AI features
- Advanced analytics may require additional configuration
- Cloud-native features limited
Platforms / Deployment
- Windows, Web
- On-premises / Hybrid
Security & Compliance
- Encryption, SSO
- Not publicly stated
Integrations & Ecosystem
- ITSM: ServiceNow, Jira
- Cloud monitoring: AWS, Azure
- APIs for reporting and automation
Support & Community
Enterprise support, documentation, and community forums.
#6 — WhatsUp Gold
Short description : WhatsUp Gold provides network and application monitoring with alerting, visualization, and reporting capabilities for enterprise networks.
Key Features
- Real-time device and application monitoring
- Automated alerts and threshold notifications
- Bandwidth utilization and traffic analysis
- Dashboards and customizable reporting
- Multi-site network monitoring
- ITSM and cloud integrations
Pros
- Simple to deploy and manage
- Good visualization and reporting
- Scales for multi-site networks
Cons
- Limited advanced AI features
- Cloud monitoring requires additional modules
- Enterprise support may vary
Platforms / Deployment
- Windows, Web
- On-premises / Hybrid
Security & Compliance
- Encryption, SSO
- Not publicly stated
Integrations & Ecosystem
- Cloud: AWS, Azure
- ITSM: ServiceNow, Jira
- APIs for monitoring and automation
Support & Community
Enterprise support, documentation, and user community.
#7 — Icinga
Short description : Icinga is an open-source network monitoring platform that tracks availability, performance, and health across servers, devices, and applications.
Key Features
- Multi-device monitoring
- Customizable alerting
- Performance graphs and dashboards
- Historical analytics
- API support for automation
- Integration with ITSM and cloud platforms
Pros
- Open-source and flexible
- Strong community support
- Scalable for enterprise environments
Cons
- Technical expertise required
- Setup and maintenance may be complex
- Limited advanced AI features
Platforms / Deployment
- Windows, Linux, Web
- Self-hosted / Hybrid
Security & Compliance
- Encryption, RBAC
- Not publicly stated
Integrations & Ecosystem
- ITSM: Jira, ServiceNow
- Cloud: AWS, Azure
- APIs for custom automation
Support & Community
Community-driven support; enterprise support available.
#8 — LogicMonitor
Short description : LogicMonitor provides cloud-based network monitoring with automated alerting, performance analytics, and full-stack observability.
Key Features
- Automated device discovery
- Real-time dashboards and analytics
- AI-driven anomaly detection
- Integration with cloud and ITSM platforms
- Bandwidth and traffic analysis
- Customizable alerting
Pros
- Cloud-native and scalable
- Predictive analytics and alerting
- Quick deployment
Cons
- Enterprise pricing
- Advanced customization requires expertise
- Cloud-only deployment
Platforms / Deployment
- Web
- Cloud
Security & Compliance
- SOC 2, ISO 27001
- Encryption, SSO
Integrations & Ecosystem
- Cloud: AWS, Azure, GCP
- ITSM: ServiceNow, Jira
- APIs for custom workflows
Support & Community
Enterprise support, documentation, and professional services.
#9 — Paessler PRTG Hosted Monitor
Short description : PRTG Hosted Monitor provides cloud-based network monitoring with real-time analytics, alerting, and reporting for IT teams.
Key Features
- Cloud-based monitoring and dashboards
- Automated alerts and notifications
- Multi-protocol support (SNMP, NetFlow, packet sniffing)
- Historical data analytics
- Integration with ITSM and cloud platforms
Pros
- Quick cloud deployment
- Real-time monitoring and alerting
- Scales for enterprise environments
Cons
- Subscription cost based on sensors
- Limited on-premises visibility
- Advanced AI analytics limited
Platforms / Deployment
- Web
- Cloud
Security & Compliance
- Encryption, SSO
- Not publicly stated
Integrations & Ecosystem
- ITSM: Jira, ServiceNow
- Cloud: AWS, Azure
- APIs for automation
Support & Community
Professional support and knowledge base.
#10 — Observium
Short description : Observium provides network monitoring for enterprises, focusing on visibility, performance tracking, and alerting across devices and applications.
Key Features
- Auto-discovery of devices
- Network performance graphs
- Alerting and notifications
- Multi-vendor device support
- Historical analytics and reporting
- Integration with ITSM platforms
Pros
- Simple setup
- Open-source flexibility
- Scalable for enterprise networks
Cons
- Limited AI and predictive analytics
- Cloud monitoring requires customization
- Community support varies
Platforms / Deployment
- Linux, Web
- Self-hosted / Hybrid
Security & Compliance
- Encryption
- Not publicly stated
Integrations & Ecosystem
- ITSM: Jira, ServiceNow
- SNMP-based devices
- APIs for automation
Support & Community
Community-driven support; professional support for enterprise edition.
Comparison Table (Top 10)
| Tool Name | Best For | Platform(s) Supported | Deployment | Standout Feature | Public Rating |
|---|---|---|---|---|---|
| SolarWinds NPM | Enterprise IT | Windows, Web | On-prem / Hybrid | Multi-vendor network monitoring | N/A |
| Paessler PRTG | SMB to Enterprise | Windows, Web | On-prem / Hybrid | Flexible sensor-based monitoring | N/A |
| Nagios XI | Enterprise & DevOps | Windows, Linux, Web | Self-hosted / Hybrid | Plugin ecosystem & custom alerts | N/A |
| Zabbix | IT Operations | Windows, Linux, Web | Self-hosted / Hybrid | Open-source customization | N/A |
| ManageEngine OpManager | Mid-market & Enterprise | Windows, Web | On-prem / Hybrid | Traffic and bandwidth analysis | N/A |
| WhatsUp Gold | SMB to Enterprise | Windows, Web | On-prem / Hybrid | Multi-site network monitoring | N/A |
| Icinga | Enterprise IT | Windows, Linux, Web | Self-hosted / Hybrid | Open-source flexibility | N/A |
| LogicMonitor | Enterprise & Cloud IT | Web | Cloud | AI-driven anomaly detection | N/A |
| PRTG Hosted Monitor | SMB to Enterprise | Web | Cloud | Cloud-based monitoring | N/A |
| Observium | Enterprise IT | Linux, Web | Self-hosted / Hybrid | Device auto-discovery & graphing | N/A |
Evaluation & Scoring of Network Monitoring Tools
| Tool Name | Core (25%) | Ease (15%) | Integrations (15%) | Security (10%) | Performance (10%) | Support (10%) | Value (15%) | Weighted Total (0–10) |
|---|---|---|---|---|---|---|---|---|
| SolarWinds NPM | 9 | 7 | 8 | 9 | 9 | 8 | 6 | 8.2 |
| Paessler PRTG | 8 | 8 | 7 | 8 | 8 | 7 | 7 | 7.7 |
| Nagios XI | 8 | 7 | 8 | 7 | 8 | 7 | 6 | 7.5 |
| Zabbix | 8 | 7 | 7 | 7 | 8 | 7 | 6 | 7.4 |
| ManageEngine OpManager | 8 | 8 | 7 | 7 | 8 | 7 | 7 | 7.6 |
| WhatsUp Gold | 7 | 8 | 7 | 7 | 7 | 7 | 7 | 7.3 |
| Icinga | 8 | 7 | 7 | 7 | 8 | 7 | 6 | 7.4 |
| LogicMonitor | 9 | 8 | 8 | 9 | 9 | 8 | 6 | 8.2 |
| PRTG Hosted Monitor | 8 | 8 | 7 | 7 | 8 | 7 | 7 | 7.6 |
| Observium | 7 | 7 | 6 | 7 | 7 | 7 | 6 | 7.0 |
Interpretation: Weighted totals indicate comparative performance across monitoring capabilities, ease of use, integrations, security, and overall value. High scores reflect enterprise readiness; selection should align with network complexity and operational requirements.
Which Network Monitoring Tool Is Right for You?
Solo / Freelancer
Zabbix, Observium, or PRTG for smaller, flexible monitoring setups.
SMB
Paessler PRTG, ManageEngine OpManager, or WhatsUp Gold for multi-site monitoring with manageable cost.
Mid-Market
SolarWinds NPM, LogicMonitor, or PRTG Hosted Monitor for hybrid networks with predictive insights.
Enterprise
Nagios XI, LogicMonitor, SolarWinds NPM for large-scale IT infrastructures, multi-vendor environments, and AI-driven insights.
Budget vs Premium
Open-source options like Zabbix or Observium are low-cost but require technical setup; premium platforms provide advanced analytics, AI, and enterprise support.
Feature Depth vs Ease of Use
SolarWinds NPM and LogicMonitor offer extensive features and dashboards; PRTG and OpManager offer simpler, faster deployment.
Integrations & Scalability
Enterprise teams benefit from LogicMonitor, SolarWinds NPM, and Nagios XI for multi-site, multi-cloud, and high-volume monitoring.
Security & Compliance Needs
Platforms with SOC 2, ISO, encryption, and SSO features like SolarWinds NPM, LogicMonitor, and Paessler PRTG are recommended for compliance-driven environments.
Frequently Asked Questions (FAQs)
1. What pricing models exist?
Subscription-based, sensor-based, or open-source options. Enterprise editions typically offer professional support.
2. How long does onboarding take?
Open-source tools may require hours to days; enterprise solutions require configuration and integration with existing ITSM systems.
3. Can these tools scale globally?
Yes, platforms like SolarWinds NPM, LogicMonitor, and Nagios XI support multi-site, multi-cloud, and hybrid network monitoring.
4. Are AI features standard?
Enterprise tools offer AI-driven anomaly detection and predictive analytics; open-source tools may lack advanced AI.
5. What platforms are supported?
Most provide web dashboards; Windows, Linux, and some mobile support depending on the vendor.
6. How secure are these platforms?
Enterprise-grade tools offer encryption, SSO, MFA, and adhere to SOC 2 or ISO standards where stated.
7. Can these tools integrate with ITSM or monitoring platforms?
Yes, integrations with ITSM (ServiceNow, Jira), monitoring (Datadog, Splunk), and collaboration platforms (Slack, Teams) are common.
8. Do these tools replace network engineers?
No, they enhance operational efficiency, reduce manual monitoring, and provide proactive alerts.
9. What are common mistakes during implementation?
Underestimating integration complexity, misconfiguring alerts, and neglecting training for IT staff.
10. Are open-source options viable?
Yes, Zabbix, Icinga, and Observium provide flexible monitoring, though enterprise features may require paid support.
Conclusion
Network Monitoring Tools are essential for IT operations, SRE teams, and managed service providers aiming to maintain high-performance, reliable networks. Enterprise platforms like SolarWinds NPM, LogicMonitor, and Nagios XI provide AI-driven insights, multi-site scalability, and predictive analytics, while open-source tools such as Zabbix and Observium offer flexibility for SMBs and technical teams. Choosing the right platform depends on organizational size, network complexity, compliance requirements, and budget. Teams should pilot tools, validate integrations, and leverage real-time analytics to proactively manage network health and optimize performance.
Find Trusted Cardiac Hospitals
Compare heart hospitals by city and services — all in one place.
Explore Hospitals