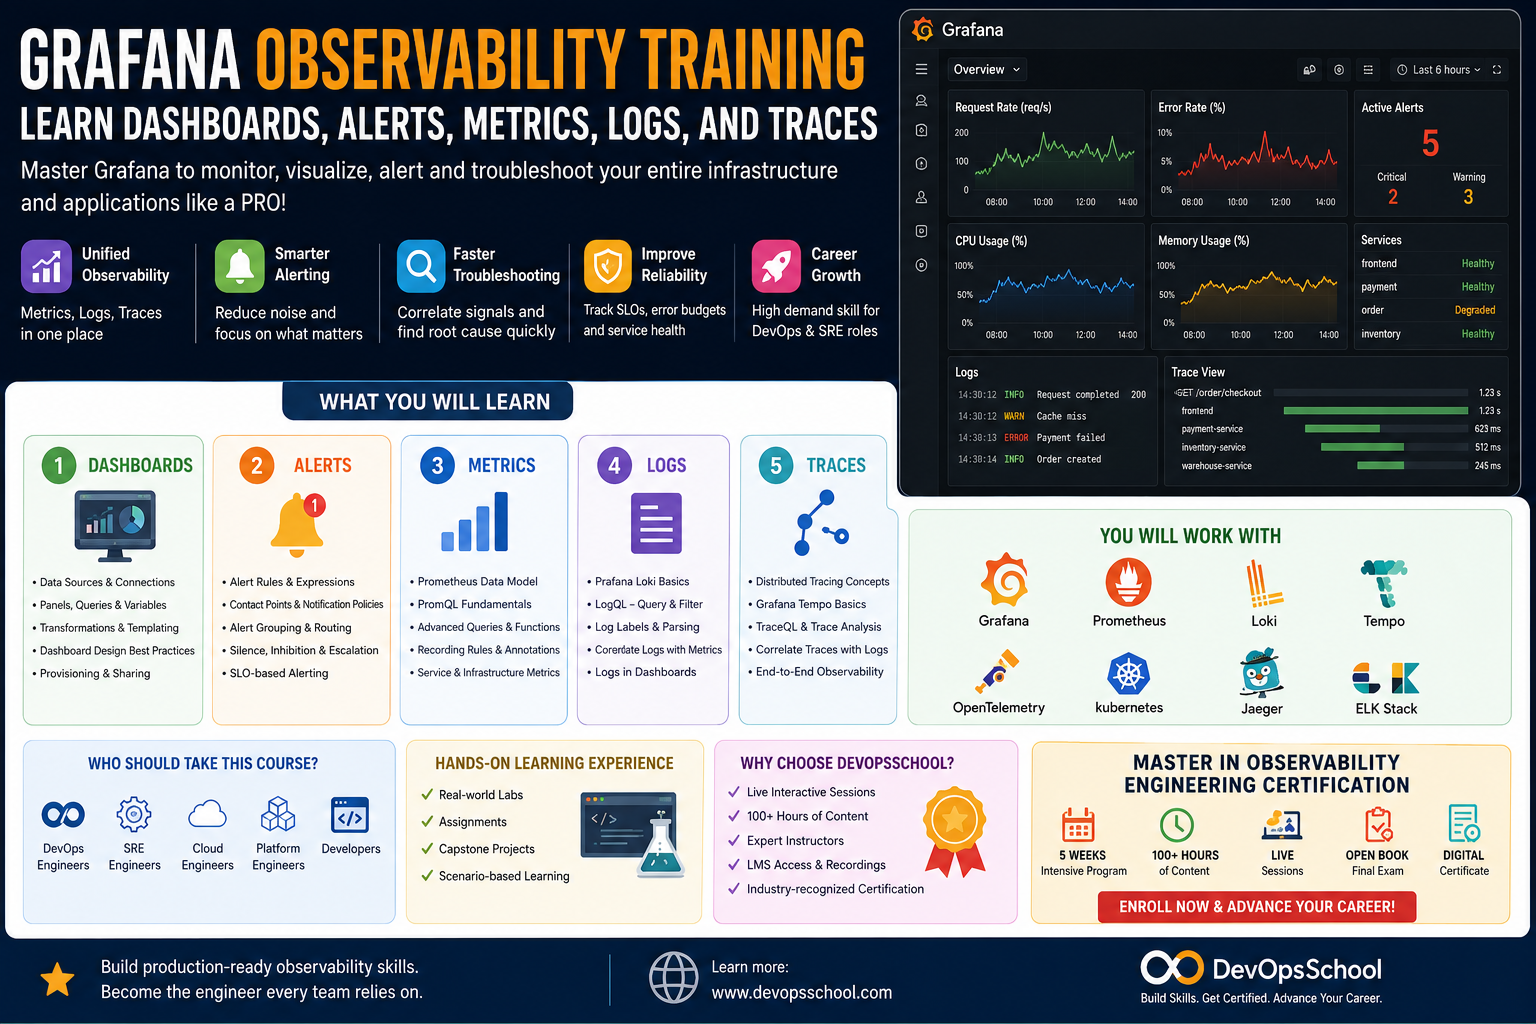
Grafana is one of the most important tools in modern observability.
But here is the truth many beginners learn the hard way:
Knowing how to create a Grafana dashboard is not the same as knowing observability.
Anyone can drag a panel, select a data source, and display a graph. That is useful, but it is only the beginning. Real Grafana observability training should teach you how to understand system behavior, connect metrics with logs and traces, design meaningful dashboards, create actionable alerts, monitor Kubernetes workloads, investigate incidents, and support DevOps and SRE teams during production issues.
Grafana becomes powerful when it is used as the central observability layer across multiple signals:
- Metrics from Prometheus
- Logs from Loki or ELK
- Traces from Tempo, Jaeger, or OpenTelemetry
- Alerts from Grafana Alerting or Alertmanager
- Kubernetes data from Prometheus Operator, kube-state-metrics, and node exporter
- SLO dashboards for reliability engineering
For DevOps engineers, Grafana helps connect infrastructure, deployment, application, and cloud visibility.
For SRE engineers, Grafana helps measure reliability, reduce alert fatigue, track SLOs, and investigate incidents faster.
For developers, Grafana helps understand how code behaves in production.
This guide explains what a complete Grafana observability training path should look like, what skills you should learn, how Grafana fits with Prometheus, Loki, Tempo, and OpenTelemetry, and why a structured certification program like the Master in Observability Engineering Certification from DevOpsSchool is a strong fit for learners who want job-ready, hands-on observability skills.
Why Grafana Matters in Observability
Modern systems generate huge amounts of telemetry data.
Applications produce logs. Infrastructure produces metrics. Kubernetes produces events. Microservices produce traces. Databases, queues, APIs, cloud services, load balancers, and containers all generate signals.
The problem is not lack of data.
The problem is making sense of the data.
Grafana helps solve this problem by giving teams a single place to visualize, correlate, alert, and investigate.
A good Grafana dashboard can answer questions like:
- Is my application healthy?
- Is request latency increasing?
- Are error rates rising?
- Which Kubernetes pod is restarting?
- Which API endpoint is slow?
- Did the latest deployment cause a problem?
- Are logs showing a matching error pattern?
- Can I jump from a metric spike to related logs?
- Can I move from logs to traces?
- Are we meeting our SLOs?
This is why Grafana is not just a dashboard tool. In a mature observability setup, Grafana becomes the operational cockpit for engineering teams.
But to use Grafana properly, you need more than UI knowledge. You need observability thinking.
Grafana Is Not Observability by Itself
One of the biggest beginner mistakes is thinking Grafana equals observability.
It does not.
Grafana visualizes and connects observability data, but the data must come from somewhere.
For example:
- Prometheus collects and stores metrics.
- Loki collects and queries logs.
- Tempo stores and queries traces.
- OpenTelemetry instruments applications and exports telemetry.
- Kubernetes exposes workload and cluster signals.
- Alertmanager or Grafana Alerting manages alert workflows.
Grafana sits on top of these systems and helps engineers make sense of them.
So, a proper Grafana observability training program should not only teach:
“How do I create a panel?”
It should teach:
“What signal should this panel show, why does it matter, and what action should an engineer take when it changes?”
That is the difference between dashboard creation and observability engineering.
What You Should Learn in Grafana Observability Training
A complete Grafana observability course should include five major areas:
- Dashboards
- Alerts
- Metrics
- Logs
- Traces
These five areas work together. If you only learn dashboards, your knowledge remains shallow. If you learn dashboards, alerts, metrics, logs, and traces together, you start thinking like a production engineer.
Let’s break them down.
1. Learn Grafana Dashboards
Dashboards are usually the first thing people associate with Grafana.
A dashboard is a visual workspace where you combine panels, charts, graphs, tables, variables, and annotations to understand system behavior.
But a professional dashboard is not just a collection of charts.
A professional dashboard answers a specific operational question.
For example:
- Service health dashboard: Is this service healthy right now?
- API performance dashboard: Which endpoints are slow or failing?
- Kubernetes dashboard: Are pods, nodes, and workloads healthy?
- Deployment dashboard: Did the latest release affect performance?
- SLO dashboard: Are we meeting reliability targets?
- Incident dashboard: What signals should we check during an outage?
Good Grafana dashboard training should teach:
- Data sources
- Panels
- Time ranges
- Variables
- Transformations
- Annotations
- Repeating panels
- Dashboard folders
- Dashboard permissions
- JSON dashboard export
- Dashboard provisioning
- Dashboard-as-code
- Drill-down views
- Cross-linking between dashboards
The most important lesson is this:
Do not build dashboards for decoration. Build dashboards for decisions.
A dashboard should help someone decide what to do next.
Dashboard Design Principles for Engineers
Many dashboards fail because they are overloaded.
A beginner often creates one dashboard with CPU, memory, disk, network, logs, latency, errors, pod status, JVM metrics, database metrics, queue metrics, and business metrics all squeezed together.
That dashboard may look impressive, but during an incident it becomes noise.
Industry teams usually prefer layered dashboards.
Layer 1: Executive or Service Health Dashboard
This dashboard gives a quick answer:
“Is the service healthy?”
It should include:
- Availability
- Error rate
- Latency
- Traffic
- SLO status
- Current incidents
- Recent deployment markers
Layer 2: Application Performance Dashboard
This dashboard helps engineers investigate application behavior.
It should include:
- Request rate
- Error rate
- Duration
- Endpoint-level latency
- Status code breakdown
- Dependency latency
- Database response time
- Queue depth
Layer 3: Infrastructure Dashboard
This dashboard focuses on resources.
It should include:
- CPU usage
- Memory usage
- Disk usage
- Network traffic
- Node health
- Container resource usage
- Pod restarts
Layer 4: Kubernetes Dashboard
This dashboard focuses on cluster workloads.
It should include:
- Namespace health
- Deployment status
- Pod readiness
- Pod restarts
- Resource requests and limits
- Node pressure
- Events
- HPA behavior
Layer 5: SLO Dashboard
This dashboard helps SRE teams measure reliability.
It should include:
- SLIs
- SLO targets
- Error budget remaining
- Burn rate
- SLO breach alerts
- Historical reliability trends
A strong Grafana observability training program should teach this kind of dashboard structure. It should not simply teach where buttons are located.
2. Learn Grafana Alerts
Dashboards are useful when someone is looking.
Alerts are useful when nobody is looking.
But alerting is where many teams go wrong.
Bad alerts wake people up for problems that do not matter. Good alerts notify the right person when action is required.
Grafana Alerting helps teams define alert rules, evaluate conditions, route notifications, group alerts, silence noise, and send alerts to tools such as Slack, email, PagerDuty, or other incident response systems.
Grafana alerting training should teach:
- Alert rules
- Query conditions
- Thresholds
- Evaluation intervals
- Contact points
- Notification policies
- Alert grouping
- Silences
- Alert labels
- Alert annotations
- Routing rules
- Escalation design
- SLO-based alerts
- Burn-rate alerts
But again, tool knowledge is not enough.
The real skill is knowing what deserves an alert.
A good alert should be:
- Actionable
- Relevant
- Urgent
- Clear
- Owned by a team
- Connected to user impact
- Supported by a runbook
A bad alert says:
“CPU is high.”
A better alert says:
“Payment API p95 latency is above the SLO threshold for 10 minutes, error budget burn rate is high, and users may experience checkout delays.”
That is the difference between infrastructure monitoring and reliability-focused observability.
Alerting Advice from Real Production Teams
Here is what experienced DevOps and SRE engineers usually recommend:
Alert on symptoms, not only causes
Instead of alerting only on CPU or memory, alert on user-facing symptoms:
- High error rate
- High latency
- Low availability
- Failed transactions
- SLO burn rate
CPU alerts can still be useful, but they should usually support investigation rather than become the only page-worthy signal.
Every critical alert needs a runbook
If an alert wakes someone up, the alert should explain what to check.
A runbook should include:
- What the alert means
- Possible causes
- First dashboards to open
- Logs to check
- PromQL queries to run
- Rollback steps
- Escalation path
Reduce duplicate alerts
If one outage causes 40 alerts, engineers waste time sorting noise.
Good alerting groups related symptoms and routes them intelligently.
Test alerts before trusting them
Do not wait for a real outage to discover that an alert is broken.
A serious observability training course should include alert testing and incident simulation.
3. Learn Metrics with Prometheus and Grafana
Metrics are the backbone of Grafana observability.
Most Grafana training paths begin with Prometheus because Prometheus is widely used for cloud-native metrics collection.
Prometheus collects time-series metrics from applications, exporters, services, and Kubernetes workloads. Grafana connects to Prometheus and visualizes that data.
To use Grafana well, you need to understand metrics well.
Important metric concepts include:
- Counters
- Gauges
- Histograms
- Summaries
- Labels
- Cardinality
- Time series
- Scrape intervals
- Aggregations
- Rate calculations
- Percentiles
- Recording rules
- Alerting rules
You also need to learn PromQL.
PromQL is the query language used to ask questions about Prometheus data.
For example, PromQL helps answer:
- What is the request rate?
- What is the error rate?
- What is p95 latency?
- Which endpoint is slow?
- Which service is failing?
- Which Kubernetes pod is using the most memory?
- Which namespace consumes the most CPU?
- Is the service breaching its SLO?
A Grafana course without PromQL is incomplete.
You can create panels without deep PromQL knowledge, but you cannot create truly useful observability dashboards without understanding the data.
Metrics Every Grafana Learner Should Know
For application observability, start with the RED method:
Rate
How many requests are coming in?
This helps understand traffic volume and load.
Errors
How many requests are failing?
This helps understand service health and user impact.
Duration
How long are requests taking?
This helps understand latency and performance.
For infrastructure observability, learn the USE method:
Utilization
How much of the resource is being used?
Examples: CPU, memory, disk, network.
Saturation
How overloaded is the resource?
Examples: queue depth, pending requests, blocked operations.
Errors
What failures are happening at the resource level?
Examples: disk errors, network errors, container restarts.
A strong Grafana observability training program should teach both RED and USE because they help engineers build dashboards that are practical and easy to reason about.
4. Learn Logs with Grafana Loki
Metrics tell you what is happening.
Logs often tell you why.
Grafana Loki is a log aggregation system designed to work well with Grafana. It allows engineers to collect, query, and analyze logs from applications, containers, Kubernetes pods, and services.
Loki is commonly used with Promtail, Fluent Bit, or other log collectors.
Grafana training with Loki should teach:
- Log collection
- Labels
- Log streams
- LogQL
- Structured logs
- JSON parsing
- Log filtering
- Log aggregation
- Kubernetes pod logs
- Correlation IDs
- Trace IDs
- Log retention
- Cost-aware logging
The most important skill is correlation.
During an incident, an engineer might see an error spike in a Prometheus metric panel. From there, Grafana should help the engineer jump into related logs for the same service, namespace, pod, or trace ID.
This is where observability becomes powerful.
Instead of switching between five tools and guessing time ranges, the engineer moves from metrics to logs in context.
Logging Advice for DevOps and SRE Engineers
Good logging is not about collecting every line.
Good logging is about collecting useful information.
Here are practical suggestions:
Use structured logs
Structured JSON logs are easier to search, filter, parse, and correlate than plain text logs.
Include correlation IDs
Correlation IDs help connect logs across services.
Include trace IDs
Trace IDs help connect logs with distributed traces.
Avoid sensitive data
Do not log passwords, tokens, secrets, payment details, or personal information.
Control log volume
Too many logs increase cost and reduce signal quality.
Standardize log levels
Use DEBUG, INFO, WARN, ERROR, and FATAL consistently.
Grafana Loki becomes much more valuable when applications produce clean, structured, meaningful logs.
5. Learn Traces with Grafana Tempo and OpenTelemetry
Traces show the journey of a request across services.
In a microservices architecture, one request may pass through:
- API gateway
- Authentication service
- User service
- Payment service
- Inventory service
- Database
- Cache
- Message queue
- Third-party API
If the request is slow, metrics may show latency and logs may show errors. But traces show where time was spent.
Grafana Tempo is a distributed tracing backend that integrates with Grafana. OpenTelemetry can instrument applications and send trace data to Tempo or other tracing systems.
Grafana observability training should teach:
- Distributed tracing concepts
- Spans
- Traces
- Parent-child relationships
- Trace context propagation
- Sampling
- OpenTelemetry instrumentation
- Tempo integration
- TraceQL basics
- Service graphs
- Trace-to-log correlation
- Trace-to-metric correlation
This is especially important for SREs and backend engineers.
When a production incident involves multiple services, tracing is often the fastest path to root cause.
Why OpenTelemetry Is Important for Grafana Training
OpenTelemetry is becoming a key part of modern observability.
It helps teams collect telemetry data in a vendor-neutral way. Instead of instrumenting an application for only one platform, teams can use OpenTelemetry to collect metrics, logs, and traces and export them to multiple backends.
In a Grafana observability stack, OpenTelemetry may send:
- Metrics to Prometheus
- Logs to Loki
- Traces to Tempo
- Telemetry to commercial APM platforms
A strong Grafana observability training path should include OpenTelemetry because it teaches how telemetry is produced, collected, processed, and routed.
Without OpenTelemetry knowledge, you may know how to view data in Grafana but not how the data gets there.
With OpenTelemetry knowledge, you understand the full pipeline.
That is a big difference.
Grafana for Kubernetes Observability
Kubernetes observability is one of the most important use cases for Grafana.
Kubernetes adds layers of abstraction. Applications run inside containers. Containers run inside pods. Pods run on nodes. Services route traffic. Deployments manage replicas. Ingress handles external access. Autoscalers change capacity. Events appear and disappear quickly.
Without observability, troubleshooting Kubernetes becomes painful.
Grafana can help visualize Kubernetes data from Prometheus and other sources.
Important Kubernetes observability topics include:
- Node metrics
- Pod metrics
- Container metrics
- Namespace dashboards
- Deployment health
- Service health
- Ingress metrics
- Persistent volume usage
- Resource requests and limits
- Pod restart counts
- Kubernetes events
- HPA behavior
- Control plane metrics
- Cluster capacity
A complete Grafana training program should teach how to build dashboards for both cluster-level and application-level visibility.
For DevOps engineers, this helps with platform operations.
For SRE engineers, this helps with reliability and incident response.
For developers, this helps understand how applications behave after deployment.
Grafana and SRE: SLIs, SLOs, and Error Budgets
Grafana becomes even more powerful when connected to SRE practices.
SRE teams use observability data to measure reliability.
Important SRE concepts include:
- SLIs: service-level indicators
- SLOs: service-level objectives
- Error budgets
- Burn rate
- Incident response
- Postmortems
- Reliability dashboards
For example, instead of only showing latency as a graph, a Grafana SLO dashboard can show:
- Current availability
- Target availability
- Error budget remaining
- Burn rate
- SLO breach risk
- Historical SLO trend
- Alerts triggered by reliability impact
This changes the conversation.
Without SLOs, teams argue based on opinions.
With SLOs, teams discuss reliability using evidence.
A Grafana observability course for SRE engineers should teach how to design dashboards and alerts around user impact, not just infrastructure health.
What a Complete Grafana Observability Stack Looks Like
A practical Grafana observability stack may look like this:
Metrics
Prometheus collects application, infrastructure, and Kubernetes metrics.
Dashboards
Grafana visualizes Prometheus metrics using dashboards and panels.
Logs
Loki collects logs from applications, pods, and containers.
Traces
Tempo stores distributed traces from instrumented applications.
Instrumentation
OpenTelemetry collects and exports telemetry from services.
Alerts
Grafana Alerting or Alertmanager sends notifications when important conditions occur.
SLOs
SLO dashboards show reliability targets, error budgets, and burn rates.
Incident Response
Dashboards, logs, traces, and alerts help engineers investigate and resolve production problems.
This is the stack learners should aim to understand.
Not as isolated tools, but as one connected observability workflow.
Suggested Grafana Observability Learning Path
If you are learning Grafana from scratch, follow this path.
Stage 1: Learn Observability Foundations
Start with:
- Monitoring vs observability
- Metrics, logs, and traces
- Telemetry
- Instrumentation
- SLIs and SLOs
- Incident response basics
Do not skip this stage. It gives meaning to the tools.
Stage 2: Learn Grafana Basics
Learn:
- Grafana interface
- Data sources
- Panels
- Time ranges
- Variables
- Dashboards
- Folders
- Permissions
- Dashboard sharing
At this stage, your goal is comfort with the tool.
Stage 3: Learn Prometheus and PromQL
Learn:
- Prometheus architecture
- Exporters
- Labels
- Scraping
- PromQL basics
- Rates
- Aggregations
- Histograms
- Recording rules
- Alerting rules
This gives your Grafana dashboards real power.
Stage 4: Build Metrics Dashboards
Build dashboards for:
- Application RED metrics
- Infrastructure USE metrics
- Kubernetes pod health
- API latency
- Error rate
- Service availability
Focus on useful dashboards, not beautiful dashboards.
Stage 5: Learn Grafana Alerting
Learn:
- Alert rules
- Contact points
- Notification policies
- Alert grouping
- Silences
- SLO alerts
- Runbook links
- Alert testing
Your goal is to create alerts that engineers trust.
Stage 6: Learn Logs with Loki
Learn:
- Loki architecture
- LogQL
- Promtail or Fluent Bit
- Structured logs
- Kubernetes log collection
- Trace ID correlation
- Log panels in Grafana
Your goal is to move from metric spike to related logs quickly.
Stage 7: Learn Traces with Tempo
Learn:
- Distributed tracing
- Spans and traces
- Tempo
- TraceQL basics
- Trace-to-log correlation
- Trace-to-metric correlation
Your goal is to follow requests across services.
Stage 8: Learn OpenTelemetry
Learn:
- OTel SDKs
- Auto-instrumentation
- Manual instrumentation
- OTel Collector
- Receivers
- Processors
- Exporters
- OTLP
- Kubernetes deployment
Your goal is to understand how telemetry enters the observability stack.
Stage 9: Learn Kubernetes Observability
Learn:
- kube-state-metrics
- node exporter
- Prometheus Operator
- ServiceMonitor
- Pod metrics
- Cluster dashboards
- Kubernetes alerts
- Resource requests and limits
Your goal is to troubleshoot real cloud-native workloads.
Stage 10: Build a Capstone Project
Build a complete project:
- Deploy a microservices application
- Collect metrics with Prometheus
- Visualize with Grafana
- Collect logs with Loki
- Collect traces with Tempo
- Instrument services with OpenTelemetry
- Create alerts
- Define SLOs
- Simulate failures
- Write a postmortem
This is where learning becomes job-ready.
Recommended Grafana Observability Training and Certification
For professionals who want structured, hands-on Grafana observability training, the Master in Observability Engineering Certification by DevOpsSchool is a strong fit because it covers Grafana dashboards, alerts, Prometheus metrics, logs, traces, OpenTelemetry, Kubernetes observability, SLOs, assignments, capstone projects, and certification-based validation in one complete learning path: https://www.devopsschool.com/certification/master-observability-engineering.html
What Makes a Good Grafana Observability Training Course?
Before choosing any Grafana training, ask these questions.
Does it teach Prometheus?
Grafana without Prometheus is incomplete for metrics-based observability.
Does it teach Loki?
Logs are essential for debugging.
Does it teach Tempo or tracing?
Distributed tracing is essential for microservices.
Does it include OpenTelemetry?
OpenTelemetry is important for modern instrumentation.
Does it include Kubernetes labs?
Most modern DevOps and SRE roles involve Kubernetes.
Does it teach alerts?
Dashboards without alerts do not support on-call operations properly.
Does it teach SLOs?
SLOs connect observability with reliability.
Does it include hands-on projects?
You cannot become confident with Grafana by only watching videos.
Does it teach production troubleshooting?
A real course should teach how to diagnose incidents, not just configure panels.
If a course only teaches basic dashboard creation, it may be fine for beginners, but it will not be enough for DevOps and SRE roles.
Why DevOpsSchool’s Master in Observability Engineering Certification Is a Strong Fit
The Master in Observability Engineering Certification from DevOpsSchool is a strong fit for Grafana observability training because it does not teach Grafana in isolation.
That is important.
In real production environments, Grafana is only one part of the observability stack. To use it properly, engineers must also understand Prometheus metrics, Loki logs, Tempo traces, OpenTelemetry instrumentation, Kubernetes monitoring, alerts, and SRE practices.
The DevOpsSchool program is useful because it covers:
- Grafana dashboards
- Grafana data sources
- Grafana panels and variables
- Grafana Alerting
- Prometheus metrics
- Loki logs
- Tempo traces
- OpenTelemetry
- ELK stack
- Jaeger
- Kubernetes observability
- SLOs and error budgets
- Datadog, Dynatrace, and New Relic
- Assignments
- Capstone projects
- Scenario-based certification exam
This gives learners a broader understanding of where Grafana fits in the full observability ecosystem.
A learner does not just learn how to build a graph.
They learn how to build a production-grade observability workflow.
Why the Certification Approach Helps
Certification training is useful because it gives structure.
Many engineers learn Grafana randomly. They watch a few videos, copy dashboards from the internet, connect Prometheus, and stop there.
That approach creates partial knowledge.
A structured certification path helps you learn in the right order:
- Understand observability fundamentals
- Learn metrics
- Learn Prometheus
- Learn Grafana dashboards
- Learn alerts
- Learn logs with Loki or ELK
- Learn traces with Tempo or Jaeger
- Learn OpenTelemetry
- Learn Kubernetes observability
- Build capstone projects
- Validate skills through an exam
This kind of roadmap is better for professionals because it connects theory, tools, hands-on practice, and career validation.
The certification is not just a badge. It becomes proof that you have practiced the full workflow.
That matters for DevOps engineers, SREs, cloud engineers, platform engineers, and application support teams.
How This Training Helps DevOps Engineers
DevOps engineers need Grafana for production visibility.
They need to understand what happens after deployments, infrastructure changes, scaling events, and pipeline releases.
Grafana observability helps DevOps engineers answer:
- Did the deployment increase errors?
- Are pods restarting after release?
- Is the cluster under resource pressure?
- Are services meeting latency expectations?
- Are alerts firing correctly?
- Which logs explain the failure?
- Which dashboard should the team check first?
- Should we roll back?
The DevOpsSchool certification path is a good fit because it connects Grafana with the rest of the DevOps ecosystem:
- Kubernetes
- Prometheus
- OpenTelemetry
- Alertmanager
- Loki
- Tempo
- ELK
- Cloud platforms
- Capstone projects
For DevOps engineers, this kind of training builds the bridge between automation and operational confidence.
How This Training Helps SRE Engineers
SRE engineers need Grafana for reliability measurement.
They care about user impact, SLOs, error budgets, incident response, and reducing alert noise.
Grafana observability helps SREs answer:
- Are users affected?
- Which SLO is at risk?
- How fast are we burning the error budget?
- Which service owns the issue?
- What changed before the incident?
- Which trace shows the latency path?
- Which logs confirm the root cause?
- Was the alert useful?
- What should we improve after the postmortem?
The DevOpsSchool training is a good fit for SREs because it includes SLOs, SLIs, error budgets, burn-rate thinking, incident response, and practical debugging workflows.
For SREs, Grafana is not just a dashboard tool.
It is a reliability decision platform.
How This Training Helps Developers
Developers also benefit from Grafana observability training.
Modern development does not end when code is merged. Developers are increasingly responsible for how their services behave in production.
Grafana helps developers understand:
- Application latency
- Error patterns
- Dependency failures
- Database performance
- Trace paths
- Log context
- Deployment impact
- User-facing issues
When developers understand Grafana, Prometheus, OpenTelemetry, logs, and traces, they write more observable applications.
They add better metrics.
They produce cleaner logs.
They propagate trace context.
They debug issues faster.
They become better production engineers.
Practical Grafana Capstone Project Idea
If you want to prove Grafana observability skill, build this project:
Project: Full-Stack Grafana Observability for a Microservices Application
Deploy a sample microservices application on Kubernetes.
Then implement:
- Prometheus for metrics
- Grafana for dashboards
- Loki for logs
- Tempo for traces
- OpenTelemetry for instrumentation
- Alerting for service health
- SLO dashboard for reliability
- Failure simulation
- Postmortem report
Your final dashboard should show:
- Request rate
- Error rate
- Latency percentiles
- Kubernetes pod health
- Pod restart count
- Logs by service
- Trace links
- SLO status
- Error budget remaining
- Active alerts
Then simulate a failure:
- Increase latency in one service
- Break a dependency
- Trigger 5xx errors
- Restart pods
- Exhaust memory
- Delay database response
Use Grafana to investigate the issue.
This is the kind of project that shows real skill in interviews.
Common Mistakes in Grafana Observability
Mistake 1: Copying Dashboards Without Understanding Them
Imported dashboards are helpful, but you should understand every panel.
If a panel turns red and you do not know why, the dashboard is not helping.
Mistake 2: Too Many Panels
More panels do not mean better visibility.
Good dashboards are focused.
Mistake 3: No Clear Ownership
Every dashboard and alert should have an owner.
Otherwise, nobody maintains them.
Mistake 4: Alerting on Everything
Alert fatigue is real.
Only page people for actionable problems.
Mistake 5: Ignoring Logs and Traces
Metrics show symptoms. Logs and traces help explain causes.
Mistake 6: No SLO Thinking
Dashboards should connect to user impact and reliability goals.
Mistake 7: Manual Configuration Only
For production environments, learn dashboard provisioning and configuration as code.
Manual clicks are fine for learning, but production needs repeatability.
Recommended Learning Roadmap for Grafana Observability
Here is a simple roadmap:
Beginner Level
Learn:
- Grafana UI
- Dashboards
- Panels
- Data sources
- Basic Prometheus integration
- Simple alerts
Intermediate Level
Learn:
- PromQL
- Variables
- Transformations
- Loki logs
- Tempo traces
- Kubernetes dashboards
- Notification policies
Advanced Level
Learn:
- Dashboard provisioning
- Grafana as code
- SLO dashboards
- Burn-rate alerts
- Cross-signal correlation
- OpenTelemetry pipelines
- Incident response workflows
- Capstone projects
Professional Level
Learn:
- Multi-team dashboard strategy
- Production alert design
- Cost-aware observability
- Governance
- RBAC
- Observability platform operations
- Reliability engineering integration
This is why a full observability engineering certification is often better than a short Grafana-only tutorial. Grafana is most valuable when you understand the full production context around it.
Final Recommendation
If you want to learn Grafana properly, do not stop at dashboards.
Learn Grafana as part of a complete observability system.
Start with metrics and Prometheus. Add Grafana dashboards and alerts. Then bring in logs with Loki, traces with Tempo, instrumentation with OpenTelemetry, Kubernetes observability, and SRE practices like SLIs, SLOs, and error budgets.
That is how Grafana becomes more than a visualization tool.
It becomes a real engineering platform for troubleshooting, reliability, and production confidence.
For learners who want a guided path, the Master in Observability Engineering Certification from DevOpsSchool is a strong fit because it connects Grafana with the tools and practices used in real DevOps and SRE environments. It includes Grafana dashboards, Prometheus metrics, Loki logs, Tempo traces, OpenTelemetry, Kubernetes labs, alerting, assignments, capstones, and a scenario-based certification exam.
That combination matters.
Because the goal is not just to learn Grafana.
The goal is to become the engineer who can look at a production system, read the signals, understand the problem, and guide the team toward the fix.
That is what real Grafana observability training should deliver.
FAQs
What is Grafana observability training?
Grafana observability training teaches how to use Grafana to visualize, alert, and investigate telemetry data such as metrics, logs, and traces. A complete course should include Prometheus, Loki, Tempo, OpenTelemetry, Kubernetes observability, dashboards, alerts, and SRE practices.
Is Grafana enough for observability?
No. Grafana is the visualization and alerting layer, but observability also requires telemetry sources such as Prometheus for metrics, Loki for logs, Tempo or Jaeger for traces, and OpenTelemetry for instrumentation.
Should I learn Prometheus before Grafana?
Yes. If your goal is observability, learn Prometheus and metrics basics before going deep into Grafana dashboards. Prometheus gives Grafana meaningful data to visualize.
What should a Grafana dashboard include?
A useful Grafana dashboard should include service health, request rate, error rate, latency, infrastructure metrics, Kubernetes workload status, logs, traces, alerts, and SLO indicators depending on the use case.
What is Grafana Alerting?
Grafana Alerting allows teams to define alert rules, evaluate conditions, route notifications, group alerts, silence alerts, and notify teams when important system conditions occur.
What is the role of Loki in Grafana observability?
Loki is used for log aggregation and querying. It integrates with Grafana so engineers can move from metrics to related logs during troubleshooting.
What is the role of Tempo in Grafana observability?
Tempo is used for distributed tracing. It helps engineers follow requests across services and identify latency or failure points in microservices architectures.
Is Grafana useful for DevOps engineers?
Yes. Grafana helps DevOps engineers monitor infrastructure, deployments, Kubernetes workloads, application performance, alerts, and production health.
Is Grafana useful for SRE engineers?
Yes. SRE engineers use Grafana for SLO dashboards, error budget tracking, burn-rate alerts, incident response, reliability analysis, and production troubleshooting.
Which certification is useful for Grafana observability?
A broad observability certification that includes Grafana, Prometheus, Loki, Tempo, OpenTelemetry, Kubernetes, SLOs, and hands-on capstones is more useful than a basic dashboard-only course. DevOpsSchool’s Master in Observability Engineering Certification is a strong fit for this learning path.

Find Trusted Cardiac Hospitals
Compare heart hospitals by city and services — all in one place.
Explore Hospitals
Nice post! I got a better understanding of how Grafana helps bring metrics, logs, and traces together in one place.
Well-structured learning path for mastering modern observability.