Introduction
Single Pane of Glass IT Dashboards are unified observability and monitoring platforms that bring together data from multiple IT systems cloud infrastructure, applications, networks, logs, and security tools into one centralized view. Instead of switching between fragmented dashboards, IT teams get a single, real-time operational picture. these platforms are essential because IT environments have become highly distributed across multi-cloud, hybrid infrastructure, microservices, and SaaS ecosystems. Without unified visibility, organizations face slower incident response, higher downtime risk, and increased operational complexity.
Real-world use cases include:
- Monitoring hybrid cloud infrastructure
- Tracking application performance across microservices
- Detecting anomalies in real time using AI
- Managing network latency across global systems
- Centralizing security alerts for faster incident response
Buyers should evaluate:
- Data integration coverage
- Real-time monitoring and alerting
- AI-driven anomaly detection
- Scalability across hybrid/multi-cloud environments
- Dashboard flexibility and customization
- Security, RBAC, and compliance support
- Ease of deployment and usability
- Integration ecosystem strength
- Cost scalability
- Support and enterprise readiness
Best for: IT operations teams, DevOps engineers, SRE teams, and enterprises running complex hybrid or multi-cloud environments requiring unified visibility.
Not ideal for: Small teams with simple infrastructure, single-cloud basic setups, or organizations only needing lightweight monitoring tools.
Key Trends in Single Pane of Glass IT Dashboards
- AI-driven observability for predictive incident detection and root cause analysis
- Unified telemetry combining logs, metrics, traces, and events
- Wider adoption of OpenTelemetry standards for instrumentation
- Real-time streaming analytics for instant operational insights
- Convergence of ITSM, APM, SecOps, and cloud monitoring platforms
- Strong growth of cloud-native observability platforms
- Low-code/no-code dashboard customization for business users
- Security observability merging with DevOps monitoring (SecOps + DevOps)
- Cost optimization features for observability data management
- Expansion into edge, IoT, and distributed system monitoring
How We Selected These Tools (Methodology)
- Market adoption and enterprise usage maturity
- Completeness of observability features (logs, metrics, traces, dashboards)
- AI and automation capabilities
- Multi-cloud and hybrid infrastructure support
- Integration ecosystem and API flexibility
- Security features like RBAC, encryption, and audit logging
- Scalability for enterprise workloads
- Developer and DevOps usability
- Community and enterprise support strength
- Cross-industry applicability (SMB to enterprise)
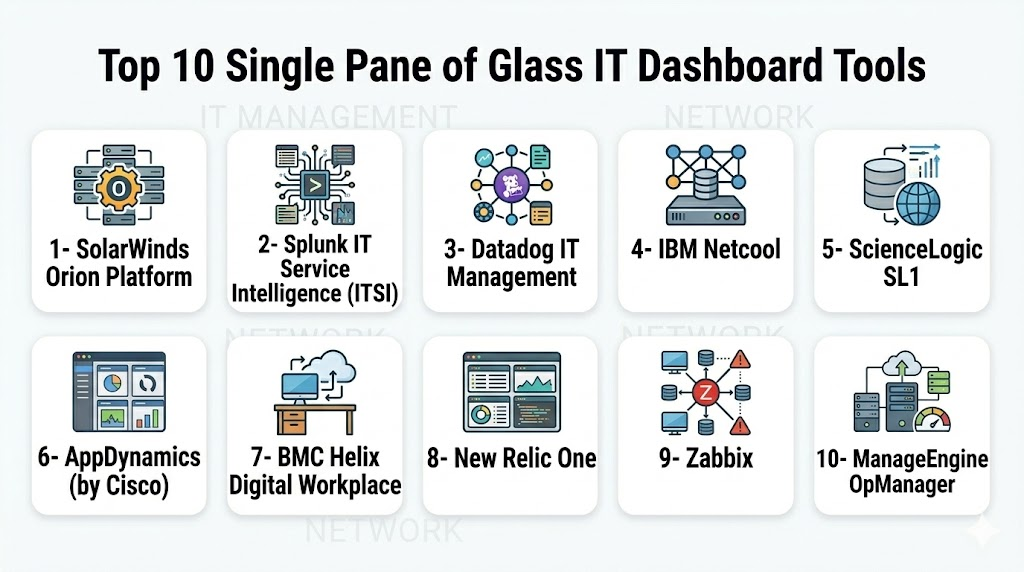
Top 10 Single Pane of Glass IT Dashboard Tools
1- Datadog
Short description: Cloud-native observability platform unifying infrastructure monitoring, APM, logs, and security analytics. Best suited for DevOps and enterprise cloud teams.
Key Features
- Unified metrics, logs, traces, and events
- Real-time infrastructure monitoring
- AI-based anomaly detection
- Kubernetes monitoring
- Cloud integrations (AWS, Azure, GCP)
- Network performance monitoring
- Custom dashboards
Pros
- Strong cloud-native coverage
- Extensive integrations ecosystem
- Highly scalable platform
Cons
- Can become expensive at scale
- Learning curve for advanced features
Platforms / Deployment
Cloud
Security & Compliance
- RBAC and SSO support
- Encryption in transit and at rest
- Not publicly stated certifications
Integrations & Ecosystem
Supports hundreds of integrations including AWS, Azure, Kubernetes, Docker, CI/CD pipelines, and API-based custom integrations.
Support & Community
Strong enterprise support and large user community with detailed documentation.
2- New Relic
Short description: Full-stack observability platform offering application performance monitoring, infrastructure visibility, and real-user monitoring in a unified dashboard.
Key Features
- Full-stack telemetry data
- APM and infrastructure monitoring
- Distributed tracing
- Real-user monitoring
- Log management
- AI-driven insights
- Custom dashboards
Pros
- Easy to use and onboard
- Strong application visibility
- Developer-friendly interface
Cons
- Pricing can scale quickly
- Advanced configurations require effort
Platforms / Deployment
Cloud
Security & Compliance
- SSO and RBAC
- Encryption support
- Compliance varies
Integrations & Ecosystem
Integrates with Kubernetes, AWS, Azure, CI/CD tools, and offers API extensibility.
Support & Community
Strong documentation and enterprise support options.
3- Dynatrace
Short description: AI-powered observability platform designed for automated monitoring, root cause detection, and full-stack system visibility.
Key Features
- Davis AI engine for root cause analysis
- Full-stack monitoring
- Automatic topology mapping
- Kubernetes observability
- Log and trace analytics
- Cloud-native support
- Dependency mapping
Pros
- Strong AI automation
- Excellent enterprise scalability
- Deep root cause analysis
Cons
- Complex initial setup
- Premium pricing
Platforms / Deployment
Cloud / Hybrid
Security & Compliance
- RBAC and SSO
- Encryption standards
- Enterprise governance features
Integrations & Ecosystem
Integrates with AWS, Azure, GCP, Kubernetes, and enterprise ITSM tools.
Support & Community
Strong enterprise support and global documentation.
4- Splunk Observability Cloud
Short description: Enterprise observability platform combining logs, metrics, and traces for deep operational intelligence.
Key Features
- Unified observability dashboards
- Distributed tracing
- Log analytics
- Infrastructure monitoring
- AI-based anomaly detection
- OpenTelemetry support
- Service monitoring
Pros
- Powerful log analytics
- Enterprise-grade reliability
- Strong scalability
Cons
- Complex setup
- High cost at scale
Platforms / Deployment
Cloud
Security & Compliance
- RBAC and audit logs
- Enterprise security controls
- Compliance varies
Integrations & Ecosystem
Strong integration ecosystem with enterprise tools, APIs, and DevOps pipelines.
Support & Community
Enterprise-grade support and extensive documentation.
5- Grafana
Short description: Open-source visualization platform used to build highly customizable IT dashboards across multiple data sources.
Key Features
- Custom dashboard creation
- Multi-source data integration
- Plugin ecosystem
- Alerting system
- Time-series visualization
- Open-source extensibility
- Cloud and self-hosting options
Pros
- Highly flexible and customizable
- Strong open-source community
- Cost-effective option
Cons
- Requires engineering effort
- Not a full observability suite alone
Platforms / Deployment
Cloud / Self-hosted / Hybrid
Security & Compliance
- Depends on deployment setup
- RBAC support available
Integrations & Ecosystem
Works with Prometheus, Loki, Elasticsearch, cloud platforms, and hundreds of plugins.
Support & Community
Very strong open-source community and enterprise support options.
6- Microsoft Azure Monitor
Short description: Native Azure monitoring service providing full-stack visibility for applications, infrastructure, and cloud resources.
Key Features
- Azure-native monitoring dashboards
- Log Analytics
- Application Insights
- Metrics and alerts
- VM and container monitoring
- AI-based insights
- Azure service integration
Pros
- Deep Azure ecosystem integration
- Strong enterprise readiness
- Easy setup in Azure environments
Cons
- Limited outside Azure ecosystem
- Pricing complexity
Platforms / Deployment
Cloud
Security & Compliance
- Azure security framework
- RBAC and identity integration
- Compliance varies by Azure setup
Integrations & Ecosystem
Deep integration with Microsoft and Azure services.
Support & Community
Enterprise Microsoft support and documentation.
7- Google Cloud Operations
Short description: Google Cloud’s unified observability platform for monitoring and diagnostics across cloud workloads.
Key Features
- Metrics and logging
- Application monitoring
- Kubernetes observability
- Error reporting and tracing
- AI-assisted insights
- Alerting system
- Cloud-native dashboards
Pros
- Strong GCP integration
- Scalable architecture
- Good AI insights
Cons
- Best within Google ecosystem
- Limited cross-cloud depth
Platforms / Deployment
Cloud
Security & Compliance
- IAM-based access control
- Google Cloud security framework
- Compliance varies
Integrations & Ecosystem
Integrates deeply with Google Cloud services and Kubernetes.
Support & Community
Google enterprise support and documentation.
8- ServiceNow IT Operations Management
Short description: Enterprise IT operations platform combining monitoring, service mapping, and workflow automation.
Key Features
- IT service mapping
- Event correlation
- AIOps capabilities
- CMDB integration
- Incident automation
- Infrastructure visibility
- Workflow automation
Pros
- Strong ITSM + ITOM integration
- Excellent workflow automation
- Enterprise governance strength
Cons
- Complex implementation
- High cost
Platforms / Deployment
Cloud / Hybrid
Security & Compliance
- RBAC and audit logging
- Enterprise governance features
- Compliance varies
Integrations & Ecosystem
Strong ITSM ecosystem and enterprise system integrations.
Support & Community
Enterprise support with consulting ecosystem.
9- SolarWinds Observability
Short description: Unified monitoring platform for infrastructure, network, and application performance visibility.
Key Features
- Network monitoring
- Infrastructure observability
- Application performance monitoring
- Cloud monitoring
- Log analytics
- Hybrid support
- Alerting dashboards
Pros
- Strong network visibility
- Broad infrastructure coverage
- Mature tooling
Cons
- Less cloud-native focus
- UI feels traditional
Platforms / Deployment
Cloud / Hybrid
Security & Compliance
- RBAC support
- Enterprise security features
- Compliance varies
Integrations & Ecosystem
Integrates with IT infrastructure and cloud environments.
Support & Community
Long-standing IT operations community and enterprise support.
10- LogicMonitor
Short description: Cloud-based hybrid infrastructure monitoring platform with automated discovery and AI-driven alerts.
Key Features
- Hybrid infrastructure monitoring
- Automated discovery
- Cloud + on-prem visibility
- AI alerting
- Custom dashboards
- Network monitoring
- Performance analytics
Pros
- Strong hybrid support
- Easy deployment
- Good automation features
Cons
- Limited deep APM depth
- Pricing scales with usage
Platforms / Deployment
Cloud
Security & Compliance
- RBAC support
- Encryption standards
- Compliance varies
Integrations & Ecosystem
Supports cloud providers, IT systems, and APIs.
Support & Community
Good enterprise support and documentation.
Comparison Table (Top 10)
| Tool Name | Best For | Platform(s) | Deployment | Standout Feature | Public Rating |
|---|---|---|---|---|---|
| Datadog | Cloud observability | Web | Cloud | Unified telemetry | N/A |
| New Relic | Full-stack monitoring | Web | Cloud | APM simplicity | N/A |
| Dynatrace | AI observability | Web | Cloud/Hybrid | AI root cause analysis | N/A |
| Splunk | Enterprise logs | Web | Cloud | Log intelligence | N/A |
| Grafana | Visualization | Web | Hybrid | Custom dashboards | N/A |
| Azure Monitor | Azure ecosystems | Web | Cloud | Native integration | N/A |
| Google Cloud Ops | GCP monitoring | Web | Cloud | Cloud-native insights | N/A |
| ServiceNow ITOM | IT operations | Web | Cloud/Hybrid | Workflow automation | N/A |
| SolarWinds | Network monitoring | Web | Cloud/Hybrid | Network visibility | N/A |
| LogicMonitor | Hybrid IT | Web | Cloud | Auto discovery | N/A |
Evaluation & Scoring
| Tool Name | Core (25%) | Ease (15%) | Integrations (15%) | Security (10%) | Performance (10%) | Support (10%) | Value (15%) | Total |
|---|---|---|---|---|---|---|---|---|
| Datadog | 9 | 8 | 9 | 8 | 9 | 8 | 7 | 8.4 |
| New Relic | 8 | 9 | 8 | 8 | 8 | 8 | 8 | 8.2 |
| Dynatrace | 9 | 7 | 8 | 9 | 9 | 9 | 7 | 8.5 |
| Splunk | 9 | 7 | 9 | 9 | 9 | 8 | 6 | 8.3 |
| Grafana | 8 | 7 | 9 | 7 | 8 | 9 | 9 | 8.1 |
| Azure Monitor | 8 | 8 | 8 | 9 | 8 | 8 | 8 | 8.2 |
| Google Cloud Ops | 8 | 8 | 8 | 9 | 8 | 8 | 8 | 8.2 |
| ServiceNow ITOM | 9 | 6 | 8 | 9 | 8 | 9 | 6 | 8.0 |
| SolarWinds | 8 | 7 | 8 | 8 | 8 | 8 | 8 | 8.0 |
| LogicMonitor | 8 | 8 | 8 | 8 | 8 | 8 | 8 | 8.1 |
Which Tool Is Right for You?
Solo / Freelancer: Grafana, New Relic
SMB: New Relic, LogicMonitor, SolarWinds
Mid-Market: Datadog, Azure Monitor, Dynatrace
Enterprise: ServiceNow ITOM, Splunk, Dynatrace
Budget vs Premium:
- Budget: Grafana, SolarWinds
- Premium: Dynatrace, Splunk, ServiceNow
Feature Depth vs Ease:
- Easy: New Relic, Azure Monitor
- Deep: Datadog, Dynatrace, Splunk
Integrations & Scalability:
- Strongest: Datadog, Grafana, Splunk
Security & Compliance:
- Strong enterprise governance: ServiceNow, Dynatrace, Splunk
Frequently Asked Questions (FAQs)
1. What is a Single Pane of Glass dashboard?
It unifies monitoring data from multiple IT systems into one centralized interface. This improves visibility and reduces operational complexity.
2. Why are these dashboards important?
They help manage distributed IT environments and improve incident response times.
3. Do these tools replace all monitoring systems?
Not always; many integrate existing tools rather than replacing them fully.
4. Are they suitable for small teams?
Yes, but lightweight tools like Grafana or New Relic are better suited.
5. Do these platforms use AI?
Most modern platforms include AI for anomaly detection and root cause analysis.
6. Can they monitor multi-cloud environments?
Yes, leading tools support AWS, Azure, and GCP simultaneously.
7. Are they expensive?
Costs vary widely based on scale, data usage, and features.
8. How hard is implementation?
It ranges from quick setup to complex enterprise deployments.
9. What is the biggest challenge?
Integrating data across legacy and modern systems.
10. What are alternatives?
Standalone monitoring tools like APM or log tools, though they lack unified visibility.
Conclusion
Single Pane of Glass IT Dashboards are essential for managing modern distributed IT systems. They unify observability across infrastructure, applications, networks, and cloud environments, enabling faster decision-making and reducing operational blind spots. However, the best tool depends on your environment, scale, and budget. A practical approach is to shortlist a few platforms, run pilots, and validate integrations before full-scale adoption.
Find Trusted Cardiac Hospitals
Compare heart hospitals by city and services — all in one place.
Explore Hospitals