Introduction
Observability Platforms are centralized solutions that provide real-time insights into system performance, infrastructure, and application health. They enable teams to monitor metrics, logs, traces, and events in one unified view, allowing for rapid detection, diagnosis, and resolution of issues.
In with cloud-native architectures, microservices, and distributed systems becoming the norm, observability has shifted from simple monitoring to full-stack, AI-powered insights. Businesses rely on these platforms to maintain uptime, optimize performance, and proactively prevent incidents.
Real-world use cases include:
- Monitoring microservices and distributed applications in real time
- Detecting anomalies in cloud infrastructure and serverless environments
- Centralizing logs and traces for debugging and root cause analysis
- Optimizing application performance and user experience
- Supporting DevOps and SRE teams in incident response and compliance reporting
Buyers should evaluate these criteria:
- Full-stack observability across infrastructure, applications, and services
- Real-time monitoring and alerting capabilities
- AI/ML-based anomaly detection and predictive insights
- Integrations with CI/CD, cloud, and DevOps tools
- Scalability and support for multi-cloud and hybrid environments
- Dashboards, analytics, and customizable visualizations
- Security, access control, and compliance features
- API support and automation
- Ease of deployment and maintenance
- Pricing and licensing flexibility
Best for: DevOps engineers, SRE teams, IT operations, enterprises managing complex systems, and SaaS providers.
Not ideal for: Small teams with simple systems, static websites, or low-complexity environments where basic monitoring tools suffice.
Key Trends in Observability Platforms
- AI-powered anomaly detection and predictive analytics
- Full-stack observability integrating logs, metrics, and traces
- Cloud-native support for multi-cloud, hybrid, and serverless architectures
- Automated alerting and incident response orchestration
- Integration with CI/CD pipelines for proactive monitoring
- Real-time dashboards and business-level KPIs
- OpenTelemetry standard adoption for consistent instrumentation
- Usage-based and subscription pricing models
- Collaboration tools for cross-functional incident management
- Enhanced security and compliance reporting
How We Selected These Tools (Methodology)
- Market adoption and brand recognition
- Feature completeness including logs, metrics, and traces
- Reliability, scalability, and performance in production environments
- Security posture, access control, and compliance capabilities
- Integration capabilities with cloud providers, DevOps, and ITSM tools
- Fit for various organizational sizes and industry requirements
- Community support and documentation quality
- AI/ML capabilities for anomaly detection and predictive insights
- Support for modern architectures: cloud-native, microservices, serverless
- Vendor roadmap, updates, and innovation
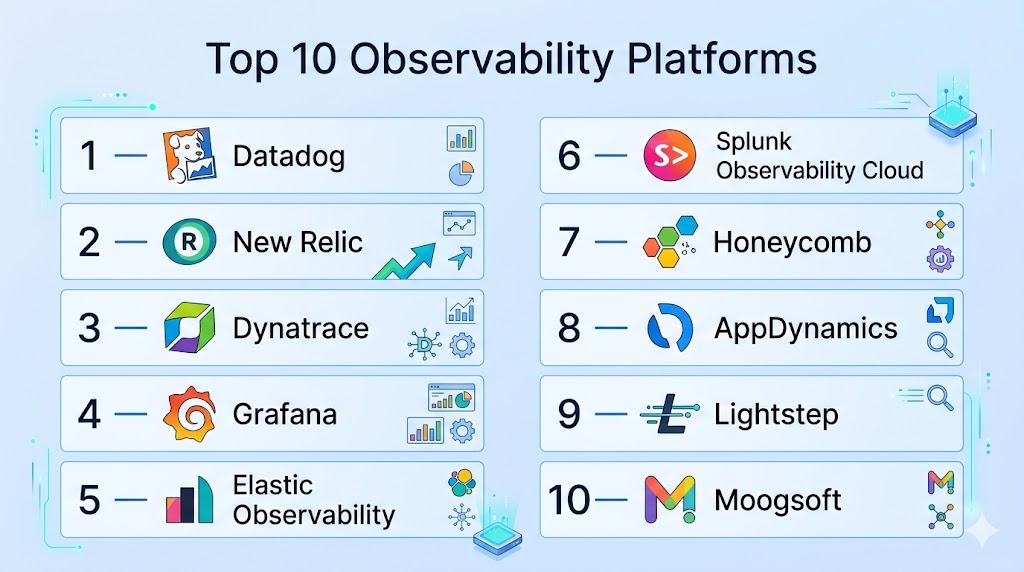
Top 10 Observability Platforms
#1 — Datadog
Short description: Datadog provides cloud-scale observability with unified monitoring for infrastructure, applications, logs, and security, ideal for DevOps and SRE teams managing multi-cloud environments.
Key Features
- Infrastructure monitoring and real-time metrics
- Application performance monitoring (APM)
- Log management and analytics
- AI-driven anomaly detection
- Security monitoring and compliance
- Custom dashboards and alerts
- Integrations with CI/CD and cloud platforms
Pros
- Comprehensive, all-in-one platform
- Strong cloud-native support and integrations
Cons
- Can be expensive for large-scale deployments
- Feature complexity may require dedicated training
Platforms / Deployment
- Web / Windows / macOS / Linux
- Cloud
Security & Compliance
- SSO, MFA, encryption, audit logs
- SOC 2, ISO 27001, GDPR
Integrations & Ecosystem
Supports hundreds of integrations across cloud, DevOps, and SaaS tools:
- AWS, Azure, GCP
- Jenkins, Kubernetes, Terraform
- Slack, PagerDuty, ServiceNow
Support & Community
- Enterprise support tiers
- Extensive documentation and active community
#2 — New Relic
Short description: New Relic delivers real-time observability for applications, infrastructure, and customer experience, enabling teams to monitor, troubleshoot, and optimize performance.
Key Features
- Full-stack monitoring and telemetry
- Distributed tracing for microservices
- Log aggregation and analytics
- AI-assisted alerts and anomaly detection
- Custom dashboards and visualization
- Integration with CI/CD pipelines
Pros
- Unified platform for performance and reliability
- AI-assisted monitoring enhances proactive issue resolution
Cons
- Licensing costs can scale with data volume
- Some advanced features require premium plans
Platforms / Deployment
- Web / Windows / macOS / Linux
- Cloud
Security & Compliance
- SSO, MFA, RBAC, audit logs
- SOC 2, ISO 27001, GDPR
Integrations & Ecosystem
- AWS, Azure, GCP, Kubernetes
- GitHub, Jira, Slack
- REST API and SDKs
Support & Community
- Enterprise support tiers
- Documentation and knowledge base
#3 — Dynatrace
Short description: Dynatrace offers AI-powered observability for applications, infrastructure, and cloud environments, focusing on automated root cause analysis and performance optimization.
Key Features
- Automatic full-stack discovery and monitoring
- AI-driven root cause analysis
- Application and service performance monitoring
- Cloud and container monitoring
- Log analytics
- User experience monitoring
- Integration with DevOps pipelines
Pros
- AI-driven insights reduce manual troubleshooting
- Strong automation and scalability
Cons
- Premium pricing tier
- Steep learning curve for new users
Platforms / Deployment
- Web / Windows / macOS / Linux
- Cloud
Security & Compliance
- SSO, MFA, audit logs
- SOC 2, ISO 27001, GDPR
Integrations & Ecosystem
- AWS, Azure, GCP, Kubernetes
- Jenkins, GitLab, Jira
- API and webhook support
Support & Community
- Enterprise support
- Knowledge base and professional services
#4 — Grafana
Short description: Grafana is an open-source platform for observability and analytics, providing customizable dashboards, metrics visualization, and alerting for DevOps and monitoring teams.
Key Features
- Multi-source metrics visualization
- Customizable dashboards
- Alerting and notifications
- Integration with Prometheus, Loki, and Tempo
- Open-source extensibility and plugins
- Collaboration features
Pros
- Open-source and highly extensible
- Cost-effective for monitoring metrics
Cons
- Requires configuration and technical knowledge
- Limited built-in APM compared to commercial platforms
Platforms / Deployment
- Web / Windows / Linux / macOS
- Cloud / Self-hosted / Hybrid
Security & Compliance
- SSO, MFA
- Not publicly stated
Integrations & Ecosystem
- Prometheus, Loki, Tempo
- Slack, PagerDuty
- REST API and plugin ecosystem
Support & Community
- Community support
- Paid enterprise support options
#5 — Elastic Observability
Short description: Elastic Observability combines logging, metrics, and APM in the Elastic Stack, providing centralized monitoring and analytics for IT and DevOps teams.
Key Features
- Log aggregation and search
- Application performance monitoring
- Infrastructure metrics and visualization
- Alerts and anomaly detection
- Kibana dashboards
- Elastic Stack integration
Pros
- Unified platform for logs, metrics, and traces
- Scalable for enterprise environments
Cons
- Requires Elastic Stack expertise
- Higher cost for enterprise features
Platforms / Deployment
- Web / Windows / Linux / macOS
- Cloud / Self-hosted / Hybrid
Security & Compliance
- SSO, MFA, encryption
- SOC 2, ISO 27001
Integrations & Ecosystem
- Cloud providers, Kubernetes, CI/CD pipelines
- API and SDKs
- Slack, PagerDuty
Support & Community
- Enterprise support
- Community forums and documentation
#6 — Splunk Observability Cloud
Short description: Splunk Observability Cloud provides real-time observability for applications and infrastructure with AI-driven insights and advanced analytics for IT and DevOps teams.
Key Features
- Full-stack observability
- Distributed tracing
- Metrics and log aggregation
- AI-driven anomaly detection
- Dashboards and analytics
- Alerting and incident workflows
Pros
- Powerful analytics and machine learning
- Scales well for large environments
Cons
- Premium pricing
- Complex setup for small teams
Platforms / Deployment
- Web / Windows / Linux / macOS
- Cloud
Security & Compliance
- SSO, MFA, encryption, audit logs
- SOC 2, ISO 27001, HIPAA
Integrations & Ecosystem
- AWS, Azure, GCP, Kubernetes
- CI/CD pipelines, Slack
- REST API and SDKs
Support & Community
- Enterprise support
- Documentation and knowledge base
#7 — Honeycomb
Short description: Honeycomb provides observability with a focus on event-driven architectures, enabling teams to analyze high-cardinality data for modern applications.
Key Features
- Event-driven observability
- Query and visualization tools
- Tracing for microservices
- Alerting and notifications
- Real-time analytics
Pros
- Optimized for modern distributed systems
- Powerful exploratory analytics
Cons
- Less suitable for traditional monolithic systems
- Learning curve for complex queries
Platforms / Deployment
- Web / Linux / macOS
- Cloud
Security & Compliance
- SSO, encryption
- Not publicly stated
Integrations & Ecosystem
- CI/CD, Kubernetes, AWS, GCP
- API support
- Slack notifications
Support & Community
- Documentation and community forums
- Enterprise support
#8 — AppDynamics
Short description: AppDynamics offers application performance monitoring, infrastructure observability, and business analytics to help teams detect and resolve issues quickly.
Key Features
- Application performance monitoring
- Infrastructure metrics
- End-user monitoring
- Alerts and anomaly detection
- Dashboards and analytics
- CI/CD integration
Pros
- Strong application and business context
- Enterprise scalability
Cons
- High learning curve
- Premium pricing
Platforms / Deployment
- Web / Windows / Linux / macOS
- Cloud / On-prem / Hybrid
Security & Compliance
- SSO, MFA, RBAC, audit logs
- SOC 2, ISO 27001
Integrations & Ecosystem
- AWS, Azure, Kubernetes
- Jira, Slack, PagerDuty
- API and SDKs
Support & Community
- Enterprise support
- Documentation and forums
#9 — Lightstep
Short description: Lightstep provides observability for complex distributed systems with real-time tracing, metrics, and root cause analysis for DevOps teams.
Key Features
- Distributed tracing
- Metrics aggregation
- Root cause analysis
- AI-assisted anomaly detection
- Dashboards and visualization
- Integration with CI/CD pipelines
Pros
- Optimized for microservices and cloud-native apps
- Fast incident resolution
Cons
- Limited infrastructure monitoring
- Enterprise pricing
Platforms / Deployment
- Web / Linux / macOS
- Cloud
Security & Compliance
- SSO, MFA, encryption
- Not publicly stated
Integrations & Ecosystem
- Kubernetes, AWS, GCP
- Slack, CI/CD pipelines
- API access
Support & Community
- Enterprise support
- Documentation and community
#10 — Moogsoft
Short description: Moogsoft provides AIOps-driven observability, correlating events and alerts to reduce noise and accelerate incident resolution for IT operations.
Key Features
- Event correlation and anomaly detection
- AI-driven alerting
- Dashboard visualizations
- Multi-cloud observability
- CI/CD integration
- Automated remediation
Pros
- Reduces alert fatigue
- Speeds up incident resolution
Cons
- Complexity for small teams
- Premium pricing
Platforms / Deployment
- Web / Windows / Linux / macOS
- Cloud / On-prem / Hybrid
Security & Compliance
- SSO, MFA, audit logs
- SOC 2, ISO 27001
Integrations & Ecosystem
- AWS, Azure, Kubernetes
- Slack, PagerDuty, ITSM tools
- API support
Support & Community
- Enterprise support tiers
- Documentation and forums
Comparison Table (Top 10)
| Tool Name | Best For | Platform(s) Supported | Deployment | Standout Feature | Public Rating |
|---|---|---|---|---|---|
| Datadog | Multi-cloud observability | Web, Windows, Linux, macOS | Cloud | Unified full-stack monitoring | N/A |
| New Relic | SaaS & DevOps teams | Web, Windows, Linux, macOS | Cloud | AI-assisted performance insights | N/A |
| Dynatrace | Enterprises | Web, Windows, Linux, macOS | Cloud | Automatic root cause analysis | N/A |
| Grafana | Visualization & metrics | Web, Windows, Linux, macOS | Cloud/Self-hosted | Highly customizable dashboards | N/A |
| Elastic Observability | Enterprise logging & APM | Web, Windows, Linux, macOS | Cloud/Self-hosted | Unified logs, metrics, traces | N/A |
| Splunk Observability Cloud | Large-scale AIOps | Web, Windows, Linux, macOS | Cloud | AI-driven anomaly detection | N/A |
| Honeycomb | Event-driven architectures | Web, Linux, macOS | Cloud | High-cardinality event analysis | N/A |
| AppDynamics | Application performance | Web, Windows, Linux, macOS | Cloud/On-prem/Hybrid | Business context observability | N/A |
| Lightstep | Microservices & distributed | Web, Linux, macOS | Cloud | Real-time distributed tracing | N/A |
| Moogsoft | IT operations & AIOps | Web, Windows, Linux, macOS | Cloud/On-prem/Hybrid | AI-driven alert correlation | N/A |
Evaluation & Scoring of Observability Platforms
| Tool Name | Core (25%) | Ease (15%) | Integrations (15%) | Security (10%) | Performance (10%) | Support (10%) | Value (15%) | Weighted Total (0–10) |
|---|---|---|---|---|---|---|---|---|
| Datadog | 9 | 8 | 9 | 9 | 9 | 8 | 7 | 8.6 |
| New Relic | 9 | 8 | 8 | 8 | 8 | 7 | 7 | 8.0 |
| Dynatrace | 9 | 7 | 8 | 9 | 8 | 7 | 6 | 7.9 |
| Grafana | 8 | 8 | 7 | 7 | 8 | 7 | 7 | 7.5 |
| Elastic Observability | 8 | 7 | 8 | 8 | 8 | 7 | 6 | 7.6 |
| Splunk Observability Cloud | 9 | 7 | 8 | 9 | 8 | 8 | 6 | 7.9 |
| Honeycomb | 8 | 7 | 7 | 8 | 7 | 7 | 6 | 7.3 |
| AppDynamics | 9 | 7 | 8 | 9 | 8 | 7 | 6 | 7.8 |
| Lightstep | 8 | 7 | 8 | 8 | 7 | 7 | 6 | 7.3 |
| Moogsoft | 8 | 7 | 8 | 8 | 8 | 7 | 6 | 7.5 |
Scores are comparative, showing relative strengths across features, usability, integrations, security, performance, support, and value.
Which Observability Platform Is Right for You?
Solo / Freelancer
Lightweight, cloud-native tools like Grafana or Honeycomb are suitable for small teams or individual developers.
SMB
Datadog, New Relic, and AppDynamics provide full-stack monitoring with analytics and alerting for growing teams.
Mid-Market
Elastic Observability, Splunk Observability Cloud, and Dynatrace are ideal for multi-environment, multi-cloud deployments requiring centralized visibility.
Enterprise
Moogsoft, Dynatrace, and Datadog support AI-driven insights, scalability, and compliance for large-scale, distributed architectures.
Budget vs Premium
Open-source or lightweight solutions like Grafana offer cost-effective observability, while enterprise platforms provide AI, automation, and advanced analytics.
Feature Depth vs Ease of Use
Enterprise-grade platforms provide comprehensive observability but require training; lightweight platforms offer ease of setup for small teams.
Integrations & Scalability
Platforms with broad integration ecosystems, such as Datadog, New Relic, and Elastic, scale effectively across hybrid and multi-cloud environments.
Security & Compliance Needs
Organizations requiring audit logs, RBAC, and regulatory compliance should prioritize Splunk Observability Cloud, Dynatrace, and Datadog for enterprise-grade features.
Frequently Asked Questions (FAQs)
1. What is an observability platform?
A platform that collects, analyzes, and visualizes metrics, logs, and traces to provide insight into system performance, reliability, and user experience.
2. How does observability differ from monitoring?
Monitoring tracks predefined metrics and alerts; observability provides deep context, enabling root cause analysis of unknown issues.
3. Can these platforms handle multi-cloud environments?
Yes, enterprise platforms like Datadog, Dynatrace, and Elastic Observability support AWS, Azure, GCP, and hybrid setups.
4. How do these platforms integrate with DevOps workflows?
They connect to CI/CD pipelines, ticketing systems, and cloud providers, enabling automated alerting and incident management.
5. Are AI features common in observability platforms?
Modern tools increasingly use AI/ML to detect anomalies, predict incidents, and reduce alert fatigue.
6. How is pricing structured?
Pricing varies: per host, per metric, or subscription-based SaaS models depending on the platform and scale.
7. Can small teams benefit from observability platforms?
Yes, lightweight or open-source solutions like Grafana and Honeycomb are suitable for small teams.
8. How do observability platforms improve user experience?
By detecting performance issues, errors, and bottlenecks proactively, teams can optimize systems and reduce downtime.
9. What mistakes should teams avoid?
Avoid alert overload, poor instrumentation, lack of dashboards, and ignoring correlation between logs, metrics, and traces.
10. Can these tools support compliance requirements?
Yes, enterprise-grade platforms provide RBAC, audit logs, and encryption to meet regulatory standards like SOC 2, ISO 27001, and GDPR.
Conclusion
Observability Platforms are critical for modern software and IT operations, providing insights into complex, distributed, and cloud-native systems. Selection depends on team size, environment complexity, integration needs, and compliance requirements. Enterprise solutions like Datadog, Dynatrace, and Splunk Observability Cloud offer comprehensive monitoring with AI insights, while lightweight platforms like Grafana and Honeycomb provide cost-effective options for small teams. Organizations should pilot shortlisted tools, validate integration with workflows, and ensure security and compliance features align with organizational policies. Effective observability improves uptime, enhances user experience, and supports proactive system management.
Find Trusted Cardiac Hospitals
Compare heart hospitals by city and services — all in one place.
Explore Hospitals