Introduction
Cartography & Map Design Tools are software solutions that enable users to create, visualize, customize, and publish maps ranging from traditional thematic maps to modern interactive web maps. They provide designers, analysts, and planners with the ability to combine data (spatial and non‑spatial) with visual design principles to communicate geographic information clearly and effectively. map design has become a core capability across industries such as logistics, urban planning, tourism, environmental science, and even marketing analytics. Maps are no longer static visuals; they are interactive interfaces, embedded in dashboards, mobile apps, and decision support systems. With the rise of big data, AI enrichment, and real‑time location feeds, cartography tools have evolved to support dynamic visuals, automated styling, and cross‑platform integrations.
Real‑world use cases include:
- Urban Planning: Designing zoning, transportation flows, and utilities on interactive city maps.
- Environmental Monitoring: Mapping pollution levels, wildlife habitats, and protected regions with layered spatial data.
- Marketing & Location Analytics: Visualizing customer density, sales territories, and proximity to retail outlets.
- Logistics & Routing: Creating route‑optimized, annotated maps for fleet and delivery operations.
- Tourism & Publishing: Crafting aesthetic printed or interactive maps for travel guides and mobile experiences.
What buyers should evaluate:
- Map styling & visual customization capabilities
- Support for spatial data formats (GeoJSON, Shapefile, KML, etc.)
- Export & publishing options (print, web, mobile)
- Integration with GIS and analytics platforms
- Real‑time data support and interactivity
- Ease of use vs. design depth
- API access & developer friendliness
- Performance & rendering speed
- Collaboration & version control
- Licensing cost & enterprise support
Best for: Designers, GIS analysts, data scientists, urban planners, logistics teams, digital product teams, and educators across SMBs to enterprise organizations that need well‑designed maps for operational use or storytelling.
Not ideal for: Users who only need basic point plotting on a map without style customization or analysis; those may prefer lightweight mapping embeds or simple GIS viewers.
Key Trends in Cartography & Map Design Tools
- AI‑Assisted Map Styling: Automated suggestions for color palettes, label placement, and symbol scaling based on design standards and accessibility.
- Real‑Time Map Data Integration: Live feeds for traffic, weather, IoT sensors, and mobility data becoming standard features.
- Web‑First Interactive Maps: Seamless deployment of interactive maps to web and mobile using responsive design standards.
- Spatial Data Fusion: Combining raster, vector, and 3D elevation datasets for richer contextual maps.
- Cloud‑Native Workflows: Team collaboration, version control, and data hosting in cloud environments.
- Augmented Reality (AR) Maps: AR overlays for navigation and contextual insights in field operations and consumer apps.
- Cross‑Platform SDKs: Consistent map experiences across platforms using shared code bases.
- Open‑Source Ecosystem Growth: Tools like open renderer engines and libraries expanding customization without vendor lock‑in.
- Automated Data Generalization: Algorithms ensure maps are readable across scales and resolutions.
- Standardized Interoperability: Improved support for standards like OGC, GeoJSON extensions, and vector tile specifications.
How We Selected These Tools (Methodology)
- Assessed market adoption and mindshare across verticals like logistics, planning, and analytics.
- Evaluated feature completeness, including styling, export options, and data support.
- Rated performance and reliability, especially with large datasets and interactive experiences.
- Examined security posture, including access controls and compatibility with enterprise authentication.
- Reviewed integration capabilities with GIS platforms, data analytics tools, and web frameworks.
- Considered ease of learning vs. depth of control for both technical and non‑technical users.
- Analyzed support and community strength, including documentation and developer ecosystems.
- Weighed flexibility of licensing and pricing models for SMBs to enterprise.
- Looked at future‑proofing, including support for AI, real‑time data, and mobile SDKs.
- Balanced open‑source vs. proprietary tools to serve different organizational needs.
Top 10 Cartography & Map Design Tools
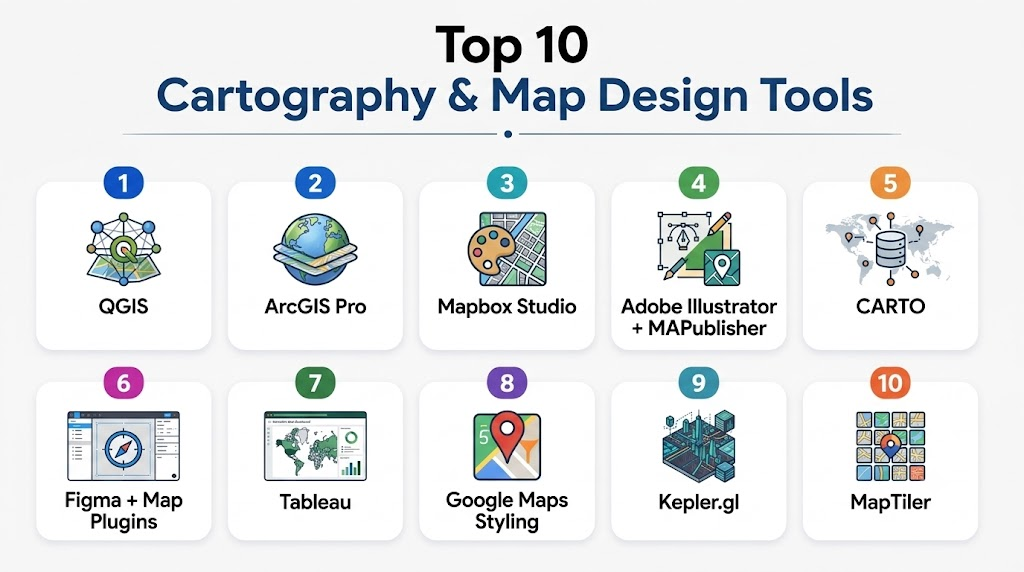
1 — QGIS
Short description:
QGIS is a leading open‑source geographic information system (GIS) with deep cartographic capabilities, ideal for detailed map design and spatial analysis.
Key Features
- Full support for raster and vector data formats
- Advanced styling, labeling, and symbolization
- Multi‑layout print composer with export options
- Plugins ecosystem for extended functionality
- Coordinate reference system support
- Spatial analysis and geoprocessing tools
- Integration with databases and remote services
Pros
- Highly customizable with plugins
- No licensing cost
- Strong community support
Cons
- Steeper learning curve for beginners
- UI can feel complex for simple tasks
Platforms / Deployment
- Windows / macOS / Linux — Self‑hosted
Security & Compliance
- Not publicly stated
Integrations & Ecosystem
QGIS connects with numerous spatial data sources and tools.
- PostGIS and spatial databases
- Plugin marketplace (e.g., styling, analysis tools)
- Python scripting (PyQGIS)
- Web map servers for publishing
- Raster and terrain data import/export
Support & Community
- Extensive documentation
- Large user community
- Tutorials and community forums
- Third‑party training resources
2 — ArcGIS Pro
Short description:
ArcGIS Pro is a professional desktop GIS and map design tool from ESRI, tailored for enterprises needing advanced cartography and spatial analytics.
Key Features
- Rich map styling and annotation tools
- Integration with ESRI’s ArcGIS platform
- 3D map design and visualization
- Advanced geoprocessing and spatial modeling
- Multi‑layout publishing
- Coordinate system and projection management
- Smart mapping tools
Pros
- Comprehensive enterprise feature set
- Deep analytics and visualization
- Tight integration with ArcGIS ecosystem
Cons
- High licensing cost
- Requires ESRI ecosystem familiarity
Platforms / Deployment
- Windows — Hybrid
Security & Compliance
- Not publicly stated
Integrations & Ecosystem
ArcGIS Pro integrates natively across ESRI’s suite.
- ArcGIS Online and Enterprise
- Spatial analysis extensions
- Database and web service connections
- Python (ArcPy) integration
- Interoperable with OGC standards
Support & Community
- Enterprise support plans
- Extensive training resources
- Large professional community
3 — Mapbox Studio
Short description:
Mapbox Studio is a cloud‑centric, design‑focused cartography tool that enables creation of custom interactive maps for web and mobile applications.
Key Features
- Style editor with real‑time preview
- Vector tile design and optimization
- Custom fonts and icons
- Theming and dark/light mode support
- Integration with SDKs for web and mobile
- Real‑time data overlays
- Preview and share capabilities
Pros
- Modern interface for designers
- Seamless web/mobile deployment
- Integrates with developer workflows
Cons
- Cost scales with usage
- Can require developer skills to deploy
Platforms / Deployment
- Web / Cloud
Security & Compliance
- Not publicly stated
Integrations & Ecosystem
Mapbox supports broad developer and data pipelines.
- SDKs for web, iOS, Android
- APIs for geocoding and routing
- Vector tile pipelines
- Integration with visualization frameworks
- Real‑time data feeds
Support & Community
- Documentation and design tutorials
- Developer community
- Enterprise support options
4 — Adobe Illustrator + MAPublisher
Short description:
MAPublisher is a cartography extension for Adobe Illustrator that brings GIS‑driven map design into a high‑end graphic design environment.
Key Features
- GIS data import (shapefiles, GeoJSON, etc.)
- Illustrator native styling and layout tools
- Data‑driven graphics and charts
- Topology validation tools
- Custom scale bar and grid tools
- High‑resolution print output
- Projection management
Pros
- Professional design control
- Ideal for publication‑quality maps
- Leverages Illustrator skillsets
Cons
- Requires Adobe Illustrator license
- Less suitable for spatial analysis
Platforms / Deployment
- Windows / macOS — Self‑hosted
Security & Compliance
- Not publicly stated
Integrations & Ecosystem
- Illustrator ecosystem
- GIS data formats
- Print and publishing workflows
- Scripting and automation via Illustrator
Support & Community
- MAPublisher-specific documentation
- Adobe design community
- Professional support tiers
5 — CARTO
Short description:
CARTO is a cloud‑native platform for spatial intelligence and web cartography, blending data analysis with interactive map design.
Key Features
- SQL and visual analysis tools
- Drag‑and‑drop map builder
- Real‑time data connect
- Thematic and choropleth mapping
- Embeddable web maps
- Widgets and filters for dashboards
- API access
Pros
- Strong spatial analysis built in
- Web deployment without coding
- Good for business intelligence use
Cons
- Can be pricey for high usage
- Design flexibility less than pure graphic tools
Platforms / Deployment
- Web / Cloud
Security & Compliance
- Not publicly stated
Integrations & Ecosystem
- Data connectors (databases, geo sources)
- APIs for embedding
- Interoperable with BI tools
- Data pipelines and real‑time feeds
Support & Community
- Tutorials and docs
- Business support plans
- Community forum
6 — Figma + Map Plugins
Short description:
Figma with map plugins empowers designers to embed and style maps inside collaborative UI/UX design workflows.
Key Features
- Vector map embeds with editable styles
- Collaboration and version control
- Plugin ecosystem for map data
- Interactive prototyping with maps
- Export to design assets
- Team libraries
Pros
- Real‑time collaboration
- Great for product and UI teams
- Flexible design controls
Cons
- Dependent on plugin quality
- Not a full GIS solution
Platforms / Deployment
- Web / macOS / Windows (via desktop app) — Cloud
Security & Compliance
- Not publicly stated
Integrations & Ecosystem
- Map plugins
- Design system libraries
- Export to code assets
- Integration with prototyping workflows
Support & Community
- Large Figma community
- Plugin marketplace
- Tutorials and design resources
7 — Tableau
Short description:
Tableau is a business intelligence platform with powerful map visualization capabilities suitable for analysts looking to combine data dashboards with spatial insights.
Key Features
- Interactive map visualization
- Layered geospatial analytics
- Data blending and filters
- Storyboards with maps and charts
- Custom color ramp and symbols
- Map layers from multiple datasets
- Export and sharing
Pros
- Familiar BI environment
- Easy map interactions
- Strong analytical integration
Cons
- Less design‑centric than dedicated tools
- Map styling options are limited compared to pure cartography tools
Platforms / Deployment
- Windows / Web — Cloud / Hybrid
Security & Compliance
- Not publicly stated
Integrations & Ecosystem
- Data connectors
- Embeddable dashboards
- API integrations
- Collaboration features
Support & Community
- Enterprise support
- Tutorials and community forums
- Training resources
8 — Google Maps Platform Styling
Short description:
Google Maps design tools offer map styling and custom overlays to tailor Google Maps for brand and usability in applications.
Key Features
- Style APIs for color and feature emphasis
- Custom marker and overlay support
- Integration with Places and routing services
- Real‑time traffic overlays
- Mobile SDKs
- Dynamic styling per user interaction
- Tile customization
Pros
- Recognizable basemap foundation
- Strong mobile & web SDK support
- Real‑time data overlays
Cons
- Licensing fees can accumulate
- Design flexibility less than standalone tools
Platforms / Deployment
- Web / iOS / Android — Cloud
Security & Compliance
- Not publicly stated
Integrations & Ecosystem
- Places and routing APIs
- Real‑time traffic feeds
- Mobile and web SDKs
- Data layers
Support & Community
- Developer documentation
- Large developer community
- Support tiers
9 — Kepler.gl
Short description:
Kepler.gl is an open‑source web tool for large‑scale geospatial data visualization with expressive map animation and layering.
Key Features
- Powerful layering and filtering
- Large dataset support
- Time‑based animation
- GPU acceleration
- Custom color and size encoding
- Export of map visuals
- Embeddable visualizations
Pros
- Fast visualization of big data
- No cost and open‑source
- Great for exploratory data maps
Cons
- Not a full cartographic design suite
- Requires data preparation skills
Platforms / Deployment
- Web — Cloud / Self‑hosted
Security & Compliance
- Not publicly stated
Integrations & Ecosystem
- GIS data import
- Integration with web dashboards
- Embedding in apps
- Plugin and extension community
Support & Community
- Open‑source community
- Documentation
- Example galleries
10 — MapTiler
Short description:
MapTiler provides tools for custom map styling and hosting with support for offline maps, ideal for applications requiring branded or offline cartography.
Key Features
- Vector and raster tile generation
- Style editor
- Offline map support
- Custom tile hosting
- Coordinate system support
- Export tools
- Mobile SDKs
Pros
- Offline capability
- Professional styling tools
- Flexible hosting
Cons
- Smaller ecosystem than larger vendors
- Some workflows require technical setup
Platforms / Deployment
- Web / Windows / macOS / Linux — Cloud / Self‑hosted
Security & Compliance
- Not publicly stated
Integrations & Ecosystem
- Mobile SDKs
- GIS data import
- Custom tile servers
- Embeddable components
Support & Community
- Documentation and examples
- Community support
Comparison Table (Top 10)
| Tool Name | Best For | Platforms Supported | Deployment | Standout Feature | Public Rating |
|---|---|---|---|---|---|
| QGIS | GIS pros & designers | Windows/macOS/Linux | Self‑hosted | Powerful open cartography | N/A |
| ArcGIS Pro | Enterprise GIS | Windows | Hybrid | Deep spatial modeling | N/A |
| Mapbox Studio | Web/mobile designers | Web | Cloud | Custom interactive maps | N/A |
| Adobe Illustrator + MAPublisher | Print & publication | Windows/macOS | Self‑hosted | High‑end design control | N/A |
| CARTO | Analytics + maps | Web | Cloud | Spatial intelligence | N/A |
| Figma + Map Plugins | UI/UX teams | Web/macOS/Windows | Cloud | Collaborative design | N/A |
| Tableau | BI analysts | Windows/Web | Cloud/Hybrid | Dashboards with maps | N/A |
| Google Maps Styling | App developers | Web/iOS/Android | Cloud | Dynamic map services | N/A |
| Kepler.gl | Big data viz | Web | Cloud/Self‑hosted | High‑performance visuals | N/A |
| MapTiler | Custom & offline maps | Web/Win/mac/Linux | Cloud/Self‑hosted | Offline & hosted tiles | N/A |
Evaluation & Scoring of Cartography & Map Design Tools
| Tool Name | Core (25%) | Ease (15%) | Integrations (15%) | Security (10%) | Performance (10%) | Support (10%) | Value (15%) | Weighted Total (0–10) |
|---|---|---|---|---|---|---|---|---|
| QGIS | 9 | 6 | 9 | 7 | 8 | 9 | 10 | 8.5 |
| ArcGIS Pro | 10 | 7 | 9 | 7 | 9 | 9 | 6 | 8.3 |
| Mapbox Studio | 8 | 8 | 9 | 7 | 8 | 8 | 7 | 8.0 |
| Illustrator + MAPublisher | 9 | 7 | 7 | 7 | 7 | 8 | 6 | 7.6 |
| CARTO | 8 | 8 | 8 | 7 | 8 | 7 | 7 | 7.7 |
| Figma + Map Plugins | 6 | 9 | 7 | 7 | 7 | 8 | 9 | 7.7 |
| Tableau | 7 | 8 | 8 | 7 | 7 | 8 | 7 | 7.6 |
| Google Maps Styling | 7 | 8 | 8 | 7 | 7 | 8 | 7 | 7.6 |
| Kepler.gl | 8 | 7 | 7 | 7 | 9 | 7 | 9 | 8.0 |
| MapTiler | 7 | 8 | 7 | 7 | 8 | 7 | 8 | 7.8 |
Which Cartography & Map Design Tool Is Right for You?
Solo / Freelancer
- QGIS or Figma + map plugins are strong choices: QGIS for spatial depth, Figma for design workflows.
SMB
- Mapbox Studio or CARTO provide web‑ready outputs and balance usability with analytics.
Mid‑Market
- Tableau, MapTiler, or Kepler.gl offer scalable visualization with strong performance at moderate cost.
Enterprise
- ArcGIS Pro or integrated ESRI stacks deliver deep capabilities and enterprise governance.
Budget vs Premium
- Budget: QGIS, Kepler.gl, Figma plugins
- Premium: ArcGIS Pro, Illustrator + MAPublisher, Mapbox Studio
Feature Depth vs Ease of Use
- Depth: ArcGIS Pro, QGIS, Illustrator + MAPublisher
- Ease: Figma + map plugins, Tableau, Mapbox Studio
Integrations & Scalability
- Cloud and API‑first tools (Mapbox Studio, CARTO) shine when you need embedding in products and dashboards.
Security & Compliance Needs
- Enterprise teams should assess platform authentication, audit controls, and compliance support directly with vendors.
Frequently Asked Questions (FAQs)
1 — What is the difference between cartography and GIS?
Cartography focuses on visual map design principles, while GIS encompasses spatial data analysis and management. Many tools bridge both.
2 — Do I need coding skills to design maps?
It depends: tools like Mapbox Studio and QGIS offer UI design, while advanced customization via APIs may require some scripting.
3 — Can I export maps for print?
Yes, tools like Illustrator with MAPublisher, QGIS, and ArcGIS Pro provide high‑resolution print exports.
4 — Are interactive maps supported?
Cloud tools such as Mapbox Studio, CARTO, and Kepler.gl excel at interactive web maps.
5 — What data formats are common?
GeoJSON, Shapefile, KML, and CSV with coordinate fields are common spatial data formats supported by most tools.
6 — Is real‑time data supported?
Some platforms (Mapbox, CARTO) allow real‑time feeds like traffic or sensor data to be layered on maps.
7 — Can I collaborate with team members?
Cloud tools and platforms with version control (Figma, CARTO) support collaborative editing and shared projects.
8 — What should I look for in map styling?
Readability, color contrast, label hierarchy, and adherence to accessibility standards are key styling considerations.
9 — Are there open‑source alternatives?
Yes: QGIS and Kepler.gl are robust open‑source options with active communities.
10 — How do I choose the right tool?
Define your use cases first: design depth, interactivity, budget, and data complexity will guide the right tool choice.
Conclusion
Cartography and map design tools have evolved beyond static visuals into dynamic, interactive, and data‑integrated platforms. In 2026 and beyond, users across sectors will benefit from tools that balance powerful styling capabilities, real‑time data integration, and seamless deployment to web and mobile. While heavy GIS platforms serve deep analytical needs, cloud‑native web tools democratize map design for broader teams. To choose wisely, align your map objectives, data complexity, and distribution channels first then shortlist and pilot a few tools to validate fit before full deployment.
Find Trusted Cardiac Hospitals
Compare heart hospitals by city and services — all in one place.
Explore Hospitals
Cartography and map design tools are most effective when they combine spatial accuracy with clear visual storytelling. By enabling users to layer geographic data, customize visual styles, and analyze spatial relationships, these platforms help transform complex datasets into intuitive, decision-ready maps for research, planning, and communication.