Introduction
Business Intelligence (BI) tools are specialized software applications designed to ingest, process, and visualize massive volumes of unstructured and structured data. These tools transform raw data into actionable insights, such as interactive dashboards, performance reports, and predictive trends. By connecting to various data sources—ranging from simple spreadsheets to complex cloud data warehouses—BI platforms provide a “single source of truth” that enables leadership teams to make data-driven decisions rather than relying on intuition.
In the business environment, BI is no longer a luxury for large corporations; it is a survival requirement for organizations of all sizes. As data velocity increases through IoT and real-time digital transactions, the ability to interpret this information instantly is a primary competitive advantage. Modern BI tools emphasize “self-service,” allowing non-technical users to build their own reports without waiting for an IT department.
Real-world use cases:
- Sales Performance Tracking: Visualizing regional sales trends, rep performance, and pipeline health.
- Financial Forecasting: Analyzing historical revenue data to predict future cash flow and budget requirements.
- Supply Chain Optimization: Monitoring inventory levels, shipping delays, and supplier performance in real-time.
- Customer Sentiment Analysis: Aggregating feedback from social media and support tickets to gauge brand health.
- Operational Efficiency: Identifying bottlenecks in manufacturing processes or service delivery through heatmaps.
Evaluation criteria for buyers:
- Data Connectivity: The range of native connectors for SQL databases, Cloud APIs, and ERP systems.
- Visualization Variety: Diversity of charts, maps, and interactive elements available.
- Self-Service Capability: How easily a non-analyst can perform “drag-and-drop” data exploration.
- AI and Machine Learning: Built-in capabilities for natural language queries (NLQ) and automated anomaly detection.
- Scalability: The platform’s ability to maintain performance as data volume grows into terabytes.
- Security & Governance: Granular control over who can see specific rows or columns of data.
- Mobile Accessibility: Quality of the mobile app for executives viewing dashboards on the go.
- Embedded Analytics: Ability to insert dashboards directly into other internal or external applications.
- Deployment Flexibility: Support for purely cloud-based, on-premises, or hybrid hosting.
- Total Cost of Ownership: Balancing license fees against the cost of training and implementation.
Best for: Data analysts, IT managers, department heads, and executives who need to synthesize data from multiple sources into a centralized, easy-to-understand format.
Not ideal for: Organizations with very low data volume (where simple spreadsheets suffice) or teams without any designated person to manage data cleanliness and governance.
Key Trends in Business Intelligence Software
- Generative BI (Augmented Analytics): The integration of LLMs allows users to ask questions in plain English (e.g., “Why did sales drop in Ohio last week?”) and receive instant visual and textual explanations.
- Real-Time Data Streaming: Platforms are moving away from daily “batch” updates toward live data streams, enabling instant reaction to market changes.
- Data Mesh & Decentralization: A shift toward allowing individual departments to own and govern their data while still contributing to a centralized BI ecosystem.
- Proactive Insights: Instead of waiting for a user to check a dashboard, BI tools now use AI to push alerts when an unusual trend is detected.
- Mobile-First Design: Dashboards are being designed specifically for vertical mobile screens with touch-responsive filtering.
- Embedded Intelligence: BI is moving out of standalone apps and directly into the tools people use daily, like Slack, Teams, or CRM systems.
- No-Code Data Prep: Automated tools that clean and join messy data sets without requiring the user to write complex SQL queries.
- Governance-as-Code: Automated security protocols that ensure data privacy compliance (like GDPR) is baked into the dashboard creation process.
How We Selected These Tools (Methodology)
To select the top 10 BI platforms, we followed a rigorous evaluation logic that mirrors the needs of modern enterprise environments:
- Market Adoption: We prioritized platforms with significant market share and a proven track record in high-stakes industries.
- Feature Completeness: Only tools that handle the full lifecycle—from data ingestion to visualization—were included.
- AI Integration Depth: We assessed how deeply AI is integrated into the core user experience rather than just being a “bolt-on” feature.
- Interoperability: The ability to work within existing tech stacks (Microsoft, Google, Salesforce) was a major factor.
- Reliability Signals: We looked at uptime reports, community forum health, and developer update frequency.
- Security Posture: Evaluation of enterprise-grade security features like row-level security and SAML authentication.
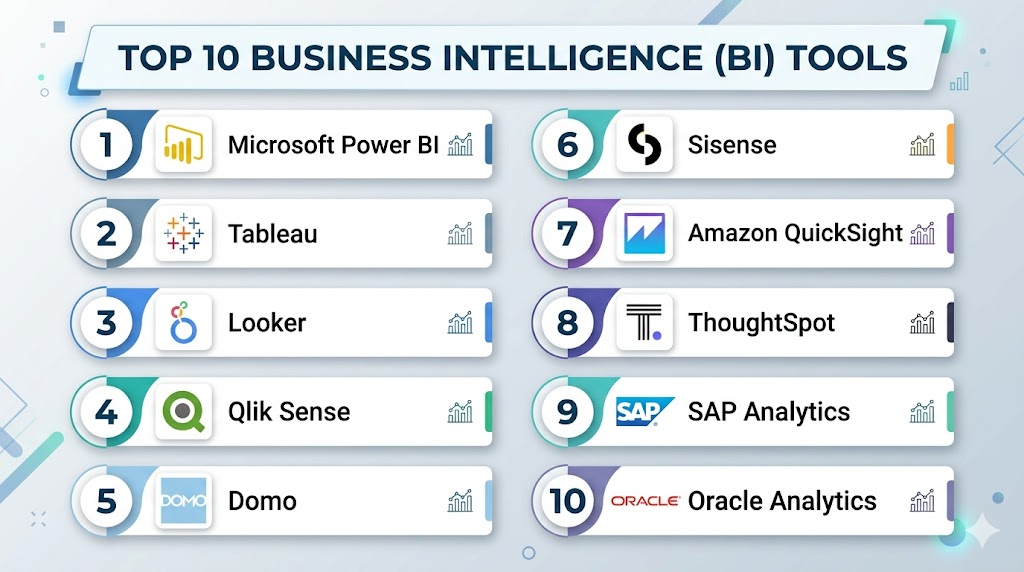
Top 10 Business Intelligence (BI) Tools
#1 — Microsoft Power BI
Short description: A versatile and widely adopted BI platform that integrates deeply with the Microsoft 365 ecosystem, offering powerful visualization and data prep capabilities.
Key Features
- Power Query: An industry-leading tool for cleaning and transforming data without code.
- Copilot Integration: AI-driven report creation and natural language data exploration.
- Seamless Excel Integration: Allows users to easily move data between spreadsheets and dashboards.
- Huge Connector Library: Native support for hundreds of cloud and on-premise data sources.
- Quick Measure Suggestions: Uses AI to help users write DAX formulas for complex calculations.
- DirectQuery: Enables real-time visualization of large datasets without moving the data.
Pros
- Extremely cost-effective for organizations already using Microsoft 365.
- One of the largest user communities in the world for troubleshooting and templates.
Cons
- The desktop application is limited to Windows users only.
- DAX language can be difficult to master for advanced custom calculations.
Platforms / Deployment
- Windows / Web / iOS / Android
- Cloud / On-premises / Hybrid
Security & Compliance
- MFA, SSO (Azure AD), Row-Level Security (RLS).
- SOC 2, ISO 27001, HIPAA, GDPR.
Integrations & Ecosystem
Power BI is the centerpiece of the Microsoft Power Platform.
- Microsoft Teams / SharePoint
- Azure Data Lake / Synapse
- Dynamics 365
- Salesforce / Google Analytics
Support & Community
Extensive documentation, Microsoft Learn paths, and a massive global community of certified professionals and user groups.
#2 — Tableau
Short description: Renowned for its best-in-class data visualization and storytelling capabilities, Tableau is favored by data scientists and visual analysts.
Key Features
- VizQL Technology: Translates drag-and-drop actions into data queries for instant visualization.
- Tableau Prep: A visual way to combine, shape, and clean data for analysis.
- Ask Data: Natural language processing that allows users to type questions to get answers.
- Advanced Mapping: Sophisticated geospatial analysis and custom map layers.
- Tableau Exchange: A marketplace for pre-built dashboards and connectors.
- Einstein Discovery: Integrated AI from Salesforce for predictive modeling.
Pros
- Unmatched flexibility in chart design and aesthetic customization.
- Handles extremely large and complex datasets with high performance.
Cons
- High price point compared to Power BI and other competitors.
- Requires a more specialized skillset to utilize its full power.
Platforms / Deployment
- Windows / macOS / Web / iOS / Android
- Cloud / On-premises / Hybrid
Security & Compliance
- SAML, OpenID, Kerberos, RLS.
- SOC 2, ISO 27001, GDPR.
Integrations & Ecosystem
Deeply integrated into the Salesforce ecosystem but maintains broad connectivity.
- Salesforce / Slack
- AWS / Snowflake
- Google BigQuery
- Python / R for statistical modeling
Support & Community
The “Tableau Public” community is a massive source of inspiration and training. Maxon provides robust enterprise support.
#3 — Looker (Google Cloud)
Short description: A modern data platform that uses a unique modeling language to ensure data consistency and provide a centralized view of business logic.
Key Features
- LookML: A powerful modeling language that defines dimensions and measures centrally.
- Looker Blocks: Pre-built pieces of code for common analytical patterns.
- Embedded Analytics: Robust APIs for building custom data applications.
- Git Integration: Version control for data models to ensure collaborative accuracy.
- Google Cloud Integration: Native performance optimization for BigQuery users.
- Actions: Trigger workflows in other apps (like Slack or Marketo) directly from data.
Pros
- Ensures everyone in the company is using the exact same data definitions.
- Highly scalable for cloud-native organizations.
Cons
- Requires knowledge of LookML to set up the initial data models.
- Less “visual” freedom in dashboard layout compared to Tableau.
Platforms / Deployment
- Web / iOS / Android
- Cloud (GCP, AWS, Azure)
Security & Compliance
- SSO, MFA, Granular permissions at the model level.
- SOC 2, ISO 27001, HIPAA (GCP level).
Integrations & Ecosystem
The heart of Google Cloud’s data strategy.
- Google BigQuery
- Google Sheets
- Slack / Jira
- Segment / Fivetran
Support & Community
Google Cloud support tiers provide 24/7 technical assistance. Active community on Google Cloud forums.
#4 — Qlik Sense
Short description: Features a unique associative engine that allows users to explore data freely in any direction without being restricted by pre-defined hierarchies.
Key Features
- Associative Engine: Highlights relationships in data across all sources automatically.
- Insight Advisor: AI assistant that suggests the best visualizations and hidden trends.
- Active Intelligence: Automates workflows based on real-time data changes.
- Qlik AutoML: Built-in machine learning for predictive analytics by non-coders.
- Multi-Cloud Architecture: Consistent experience across various cloud environments.
- Hybrid Data Integration: Real-time data movement and transformation capabilities.
Pros
- Excellent for discovering “the data you didn’t know was related.”
- Very strong performance with large, disparate datasets.
Cons
- The proprietary engine requires a different mental model than SQL-based tools.
- The development of complex apps can be time-consuming.
Platforms / Deployment
- Web / iOS / Android
- Cloud / On-premises / Hybrid
Security & Compliance
- Attribute-based access control, SSO.
- SOC 2, ISO 27001, GDPR.
Integrations & Ecosystem
Broad connectivity across diverse enterprise stacks.
- Snowflake / Databricks
- SAP / Oracle
- Microsoft Teams
- Salesforce
Support & Community
Strong training through Qlik Education Services and a loyal global user base.
#5 — Domo
Short description: A cloud-native platform designed for fast deployment and mobile-first executives, offering an end-to-end data stack.
Key Features
- Magic ETL: A visual drag-and-drop tool for data transformation.
- Beast Mode: A simplified way to create custom calculated fields.
- Domo Appstore: Over 1,000 pre-built connectors and apps.
- Buzz: Built-in collaboration tool for discussing data insights.
- Card-Based Design: Makes dashboards easy to consume on mobile devices.
- Data Science Suite: Integrated tools for R and Python scripts.
Pros
- Incredibly fast to set up; go from raw data to dashboard in hours.
- Superior mobile experience compared to legacy tools.
Cons
- Can be expensive as data volume and user count grow.
- The platform can feel like a “black box” for highly technical users.
Platforms / Deployment
- Web / iOS / Android
- Cloud-only
Security & Compliance
- SAML, RLS, SSO.
- SOC 2, ISO 27001, HIPAA.
Integrations & Ecosystem
One of the largest libraries of native connectors in the industry.
- Amazon S3
- Google Analytics 4
- Zendesk / HubSpot
- Facebook Ads
Support & Community
Excellent customer success managers and the “Domo Dojo” community forum.
#6 — Sisense
Short description: Specialized in embedded analytics, Sisense allows companies to build and scale custom data applications for their own customers.
Key Features
- In-Chip Technology: High-speed data processing that optimizes CPU cache.
- Sisense Fusion: A platform that embeds analytics into any workflow or product.
- Elasticube: A high-performance analytical database for complex data joins.
- BloX: A framework for building highly customized, actionable UI components.
- AI Insights: Automated discovery of outliers and trend drivers.
- Git Integration: Professional development workflow for analytics code.
Pros
- The best choice for embedding white-labeled dashboards into your own software.
- Extremely efficient handling of messy, complex data relationships.
Cons
- Lacks the broad “office” familiarity of Microsoft or Google tools.
- Steep learning curve for setting up Elasticubes correctly.
Platforms / Deployment
- Web / iOS / Android
- Cloud / On-premises (Linux/Windows)
Security & Compliance
- SSO, RLS, Active Directory integration.
- SOC 2, ISO 27001, HIPAA.
Integrations & Ecosystem
Focuses on developer-friendly hooks and API connectivity.
- Snowflake / Amazon Redshift
- MongoDB
- Salesforce
- Slack
Support & Community
High-touch customer support and a developer-centric community portal.
#7 — Amazon QuickSight
Short description: A fast, cloud-powered BI service from AWS that offers per-session pricing and deep integration with the AWS data lake.
Key Features
- SPICE Engine: A Super-fast, Parallel, In-memory Calculation Engine.
- QuickSight Q: Natural language querying for instant answers.
- Embedded Dashboarding: Easy integration into SaaS applications.
- Auto-Narratives: Automatically generates plain-language summaries of data.
- ML Insights: Built-in forecasting and anomaly detection.
- Pay-per-session Pricing: Only pay for the time users actually spend in the tool.
Pros
- Lower entry cost for sporadic users compared to monthly subscriptions.
- Native performance for data already sitting in AWS (S3, Redshift, RDS).
Cons
- Visualization options are less mature than Tableau or Power BI.
- The interface can feel sparse to power users.
Platforms / Deployment
- Web / iOS / Android
- Cloud-only (AWS)
Security & Compliance
- IAM integration, SSO, RLS.
- SOC 2, ISO 27001, HIPAA, FedRAMP.
Integrations & Ecosystem
Tightly coupled with the AWS ecosystem.
- Amazon Redshift / Athena / S3
- Salesforce / Adobe Analytics
- Snowflake
- Jira
Support & Community
AWS Enterprise Support and the AWS Community Builders network.
#8 — ThoughtSpot
Short description: A “Search & AI-Driven” analytics platform that allows users to explore data as easily as using a search engine.
Key Features
- Search-IQ: A search-based interface for data exploration.
- SpotIQ: Automatically generates insights from a user’s search query.
- Liveboards: Interactive dashboards that update in real-time.
- ThoughtSpot Sage: Generative AI for translating human questions into SQL.
- Data Workspace: A centralized place for modeling and governance.
- ThoughtSpot Everywhere: A developer platform for embedding search-driven analytics.
Pros
- Eliminates the “bottleneck” of waiting for analysts to build dashboards.
- Users love the familiar, search-bar-driven experience.
Cons
- Requires a very clean underlying data model to function well.
- Pricing can be complex based on data consumption.
Platforms / Deployment
- Web / iOS / Android
- Cloud-only
Security & Compliance
- SAML, RLS, Column-level security.
- SOC 2, ISO 27001.
Integrations & Ecosystem
Works directly with modern cloud data warehouses.
- Snowflake / Databricks
- Google BigQuery
- Amazon Redshift
- Azure Synapse
Support & Community
ThoughtSpot University and a growing community of AI-analytics enthusiasts.
#9 — SAP Analytics Cloud
Short description: Combines BI, planning, and predictive analytics in a single cloud environment, primarily for users of the SAP ecosystem.
Key Features
- Augmented Analytics: AI-driven data exploration and “Smart Insight” features.
- Enterprise Planning: Integrated tools for financial and operational budgeting.
- Digital Boardroom: A high-level executive view for boardroom presentations.
- Data Modeling: Professional-grade tools for complex enterprise data structures.
- Smart Predict: Machine learning for time-series forecasting.
- Direct SAP Connectivity: Live data connection to SAP S/4HANA and BW.
Pros
- The best choice for companies already heavily invested in SAP ERP.
- Combines planning and BI, reducing the need for separate tools.
Cons
- Can be difficult to integrate with non-SAP systems.
- Interface is geared toward enterprise users and can feel complex.
Platforms / Deployment
- Web / iOS / Android
- Cloud-only
Security & Compliance
- SAML, RLS, SAP Cloud Identity.
- SOC 2, ISO 27001, HIPAA.
Integrations & Ecosystem
Designed specifically for the SAP Intelligent Enterprise.
- SAP S/4HANA / SAP BW
- Salesforce
- Google Drive
- SQL Server
Support & Community
Professional support through the SAP ecosystem and SAP Community network.
#10 — Oracle Analytics Cloud
Short description: A robust enterprise platform that provides a unified environment for data preparation, visualization, and advanced AI-driven insights.
Key Features
- Self-Service Data Prep: Automated data enrichment and cleaning suggestions.
- Natural Language Generation: Explains dashboard insights in plain English text.
- Mobile Day by Day: An AI-powered app that learns what data you need each day.
- Advanced Analytics: One-click predictive functions and clustering.
- Data Lake Integration: Analyzes data across object storage and databases.
- Enterprise Reporting: High-volume, pixel-perfect document generation.
Pros
- Comprehensive features for large-scale enterprise reporting and governance.
- Deeply integrated with Oracle Autonomous Database.
Cons
- Can feel heavy and complex for small businesses.
- The mobile app experience is distinctive and requires a learning curve.
Platforms / Deployment
- Web / iOS / Android
- Cloud / On-premises / Hybrid
Security & Compliance
- Identity Cloud Service (IDCS), RLS.
- SOC 2, ISO 27001, HIPAA, FedRAMP.
Integrations & Ecosystem
Optimized for the Oracle Cloud Infrastructure (OCI).
- Oracle Database / NetSuite
- Microsoft Azure
- Salesforce
- Adobe Analytics
Support & Community
Oracle Support services and the Oracle Analytics user community.
Comparison Table (Top 10)
| Tool Name | Best For | Platform(s) Supported | Deployment | Standout Feature | Public Rating |
| Microsoft Power BI | Microsoft Ecosystem | Win, Web, Mobile | Hybrid | Copilot AI | 4.6/5 |
| Tableau | Visual Storytelling | Win, Mac, Web, Mobile | Hybrid | VizQL Engine | 4.7/5 |
| Looker | Data Governance | Web, Mobile | Cloud | LookML Modeling | 4.5/5 |
| Qlik Sense | Data Discovery | Web, Mobile | Hybrid | Associative Engine | 4.5/5 |
| Domo | Executive Dashboards | Web, Mobile | Cloud | Mobile Experience | 4.4/5 |
| Sisense | Embedded Analytics | Web, Mobile | Hybrid | In-Chip Processing | 4.3/5 |
| Amazon QuickSight | AWS Users | Web, Mobile | Cloud | Pay-per-session | 4.2/5 |
| ThoughtSpot | Search-Driven BI | Web, Mobile | Cloud | Search-IQ | 4.6/5 |
| SAP Analytics Cloud | SAP Ecosystem | Web, Mobile | Cloud | Integrated Planning | 4.3/5 |
| Oracle Analytics Cloud | Enterprise Reporting | Web, Mobile | Hybrid | Natural Language Gen | 4.2/5 |
Evaluation & Scoring of Business Intelligence Software
The following scores represent how each tool performs across the weighted criteria established in our methodology.
| Tool Name | Core (25%) | Ease (15%) | Integrations (15%) | Security (10%) | Performance (10%) | Support (10%) | Value (15%) | Weighted Total |
| Power BI | 9 | 8 | 10 | 9 | 8 | 10 | 10 | 9.15 |
| Tableau | 10 | 7 | 9 | 9 | 10 | 9 | 6 | 8.55 |
| Looker | 8 | 6 | 9 | 10 | 9 | 8 | 7 | 7.95 |
| Qlik Sense | 9 | 7 | 8 | 9 | 9 | 8 | 7 | 8.10 |
| Domo | 8 | 9 | 10 | 8 | 8 | 8 | 5 | 7.75 |
| Sisense | 9 | 6 | 9 | 9 | 9 | 7 | 7 | 8.05 |
| QuickSight | 7 | 8 | 9 | 10 | 9 | 8 | 9 | 8.20 |
| ThoughtSpot | 8 | 10 | 8 | 8 | 8 | 7 | 7 | 8.10 |
| SAP Analytics | 8 | 5 | 7 | 10 | 9 | 8 | 6 | 7.40 |
| Oracle Analytics | 9 | 6 | 8 | 10 | 9 | 8 | 6 | 8.00 |
How to Interpret These Scores:
- Weighted Total: A score above 8.5 indicates a versatile market leader.
- Value: Tools with high value (Power BI, QuickSight) are more accessible for smaller budgets.
- Ease: Higher scores (ThoughtSpot, Domo) indicate a faster “time-to-insight” for non-technical users.
Which Business Intelligence Tool Is Right for You?
Solo / Freelancer
For an individual or consultant, Microsoft Power BI (Free/Pro version) is often the best choice due to its low cost and the ability to easily share reports via the web. If you work on Mac, Tableau or the cloud-based QuickSight are better alternatives.
SMB
Small businesses with limited IT resources should prioritize Domo or ThoughtSpot. These platforms minimize the need for complex data engineering and allow owners to get answers quickly through a search-based or app-based interface.
Mid-Market
Companies with growing data teams will find Tableau or Qlik Sense highly effective. These tools allow for deeper exploration and more sophisticated storytelling, which is crucial as business logic becomes more complex.
Enterprise
For large-scale organizations, the choice often depends on their existing cloud ecosystem. Power BI for Azure shops, Looker for Google Cloud shops, and SAP Analytics Cloud for those running SAP ERP are the most logical, high-security choices.
Budget vs Premium
- Budget: Amazon QuickSight (Pay-per-session) or Power BI ($10-20/user).
- Premium: Tableau, Domo, and SAP Analytics Cloud.
Feature Depth vs Ease of Use
- Deep Depth: Tableau, Qlik Sense, and Oracle Analytics.
- Easy to Use: ThoughtSpot, Domo, and Power BI.
Integrations & Scalability
- Best Integrations: Domo and Power BI.
- Best Scalability: Looker, Sisense, and Amazon QuickSight.
Security & Compliance Needs
Organizations in highly regulated sectors (Finance, Healthcare, Govt) should prioritize QuickSight, Looker, or Oracle Analytics Cloud, as they offer the most comprehensive set of global compliance certifications.
Frequently Asked Questions (FAQs)
1. What is the difference between BI and Data Science?
BI focuses on describing the past and present state of a business through dashboards and reports. Data Science uses statistical models and algorithms to predict future outcomes and find hidden patterns.
2. How long does it take to implement a new BI tool?
For a single department with clean data, it can take 2-4 weeks. For an enterprise-wide rollout with complex data integration and governance, implementation can take 3-9 months.
3. Do I need to be a coder to use these tools?
Most modern BI tools are “low-code” or “no-code” for basic reporting. However, advanced data modeling and custom integrations usually require knowledge of SQL or proprietary languages like DAX or LookML.
4. Can BI tools handle real-time data?
Yes, many tools like Qlik Sense, Power BI, and QuickSight offer direct connections to streaming data sources to provide near-instant dashboard updates.
5. What is the biggest mistake companies make with BI?
Buying a tool before cleaning their data. If the underlying data is messy or inconsistent, the most expensive BI tool in the world will only produce “trash in, trash out” insights.
6. Are BI tools secure for sensitive financial data?
Yes, enterprise-grade BI tools offer row-level security (RLS), which ensures that a regional manager, for example, can only see data pertaining to their specific region and nothing else.
7. How much do BI tools typically cost?
Pricing varies widely. Some start at $10 per user/month, while enterprise contracts can reach hundreds of thousands of dollars annually based on data volume and server capacity.
8. Can I use these tools on my mobile phone?
Almost all top-tier BI tools offer dedicated iOS and Android apps that allow you to filter, drill down, and comment on dashboards while away from your desk.
9. What is “Embedded Analytics”?
This is the practice of taking a dashboard created in a BI tool and placing it inside another application (like your company’s internal portal or a customer-facing product).
10. Do I still need Excel if I have a BI tool?
While BI tools replace Excel for large-scale reporting, Excel remains a valuable tool for “ad-hoc” calculations and small-scale data entry that hasn’t yet been formalized in a database.
Conclusion
Business Intelligence tools have evolved from complex, IT-heavy systems into intuitive platforms that empower every employee to be a data analyst. Whether you choose the ecosystem-deep integration of Power BI, the visual elegance of Tableau, or the search-driven simplicity of ThoughtSpot, the goal remains the same: clarity.To succeed, remember that the tool is secondary to the strategy. Start by identifying the three most critical questions your business needs to answer, ensure your data sources are clean, and run a pilot program with a small group of users before committing to a full enterprise rollout.
Find Trusted Cardiac Hospitals
Compare heart hospitals by city and services — all in one place.
Explore Hospitals