Introduction
Data observability refers to an organization’s ability to understand the health and state of the data within their system. In the current era of complex distributed systems, it is no longer enough to simply monitor if a pipeline is running; teams must have deep visibility into the quality, reliability, and lineage of the data itself. These tools utilize automated profiling, machine learning-based anomaly detection, and end-to-end lineage to alert engineers when data “downtime” occurs. By applying DevOps and Site Reliability Engineering (SRE) principles to data, these platforms ensure that the information driving business decisions is accurate, timely, and complete.
As organizations move toward decentralized data mesh architectures and AI-driven decision-making, the cost of “bad data” has reached a critical threshold. Data observability tools act as an insurance policy against silent data failures—instances where pipelines remain active, but the data flowing through them is corrupted, missing, or duplicated. From detecting schema changes that break downstream dashboards to identifying unexpected volume drops in a data warehouse, these platforms provide the operational layer necessary for modern data stacks.
Real-World Use Cases:
- Predictive Analytics Reliability: Ensuring that machine learning models are not trained on stale or drifted data.
- Financial Reporting Accuracy: Validating that data used for quarterly filings is consistent across multiple source systems.
- Customer Experience Monitoring: Tracking real-time event streams to ensure personalized marketing engines receive correct user data.
- Regulatory Compliance: Maintaining strict data lineage to satisfy audit requirements regarding data origin and transformations.
- Pipeline Optimization: Identifying bottlenecks and unused datasets to reduce cloud storage and compute costs.
Evaluation Criteria for Buyers:
- Ease of Integration: How quickly the tool connects to existing warehouses, lakes, and orchestration tools.
- Automated Profiling: The ability to automatically learn baseline data patterns without manual configuration.
- End-to-End Lineage: Whether the tool tracks data from ingestion through transformation to the BI layer.
- Anomaly Detection Accuracy: The precision of ML models in identifying outliers while minimizing “alert fatigue.”
- Root Cause Analysis: Specificity of the alerts in pointing to the exact broken transformation or upstream source.
- Data Contract Support: The ability to enforce and monitor shared agreements between data producers and consumers.
- Scalability: How the tool handles massive datasets with millions of rows without impacting performance.
- Security and Privacy: Features like PII detection and role-based access control (RBAC).
- Deployment Models: Options for SaaS, self-hosted, or hybrid deployments.
- Cost to Value: The ROI generated by reducing data downtime versus the subscription and compute overhead.
Mandatory Paragraph
- Best for: Data engineers, analytics leads, and Chief Data Officers (CDOs) in mid-market and enterprise organizations who manage high-volume data pipelines and mission-critical BI.
- Not ideal for: Very small teams with a single, static data source, or organizations where data accuracy is not a primary driver for operational or strategic decisions.
Key Trends in Data Observability Tools for the Modern Era
- Shift toward Data Contracts: Platforms are increasingly moving from “detecting” failures to “preventing” them by enforcing strict schemas and quality standards at the point of ingestion.
- AI-Driven Root Cause Identification: Modern tools use large language models and graph analysis to explain why a failure occurred, suggesting specific fixes rather than just flagging an error.
- FinOps for Data: Observability is expanding into cost management, allowing teams to see which datasets are the most expensive to process and which are never used.
- Active Metadata Management: Moving beyond static documentation, metadata is now used dynamically to trigger automated pipeline adjustments or security protocols.
- Self-Healing Pipelines: The emergence of automated remediation where the observability tool can trigger a pipeline restart or a data roll-back when quality thresholds are breached.
- Decentralized Observability: Supporting “Data Mesh” environments by allowing individual business units to manage their own observability rules while maintaining central governance.
- Governance and Privacy Convergence: Tools are integrating data discovery and PII (Personally Identifiable Information) masking as part of the standard observability workflow.
- Zero-Trust Data Architecture: Applying security principles to data health, ensuring that no data is trusted until it has been verified by the observability layer.
How We Selected These Tools (Methodology)
The selection of the top 10 tools listed in this guide followed a structured evaluation logic to ensure a balanced perspective for technical buyers:
- Market Presence and Adoption: We prioritized tools that are widely recognized and currently used by major technology firms and enterprises.
- Technical Sophistication: We analyzed the depth of the ML models used for anomaly detection and the granularity of their lineage tracking.
- Ecosystem Compatibility: Evaluation was based on how well the tools integrate with popular stacks (Snowflake, Databricks, dbt, Airflow).
- Enterprise Readiness: We assessed features like Single Sign-On (SSO), RBAC, and multi-tenancy support.
- User Feedback and Mindshare: We weighed community signals and professional reviews regarding the “usability” and actual reduction in data downtime.
- Innovation Trajectory: Preference was given to vendors who are actively shipping features related to AI integration and data contract enforcement.
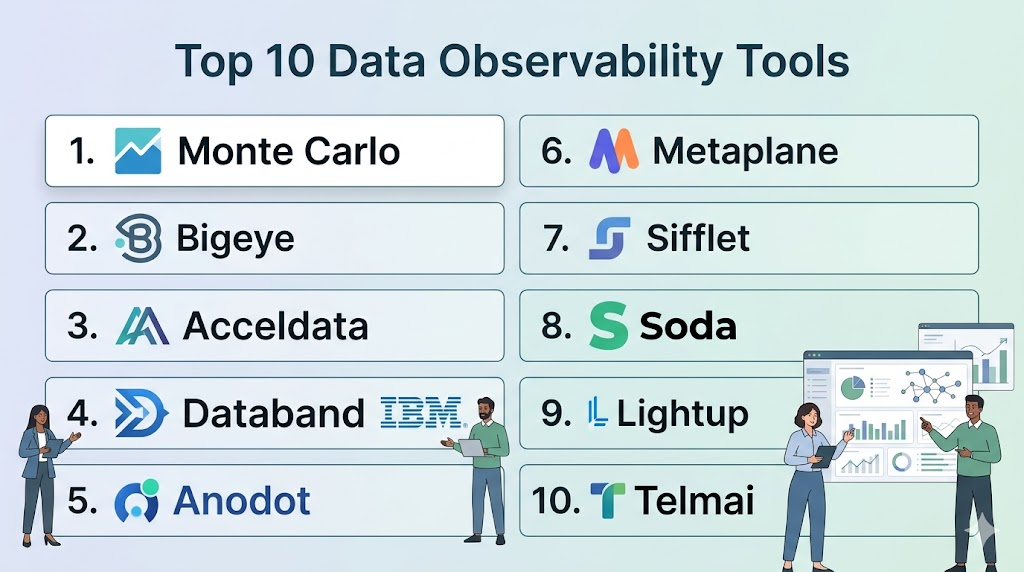
Top 10 Data Observability Tools
#1 — Monte Carlo
Short description: Often credited with pioneering the category, Monte Carlo is a comprehensive, enterprise-grade platform that provides “end-to-end” data observability. It focuses on reducing data downtime through automated monitoring and resolution.
Key Features
- Automated Data Health Monitoring: Tracks freshness, volume, and schema changes without manual threshold setting.
- End-to-End Lineage: Automatically maps dependencies from the source system down to the individual BI dashboard.
- Incident Management: Provides a centralized workspace for teams to collaborate on resolving data issues.
- Data Reliability Dashboards: Offers high-level metrics on data uptime and team performance for leadership.
- Field-Level Lineage: Allows users to trace specific data points through complex SQL transformations.
- Query Impact Analysis: Predicts which downstream assets will break before a change is deployed.
Pros
- Minimal setup time; starts providing value almost immediately after connecting to a warehouse.
- Broadest set of native integrations in the industry.
Cons
- Pricing can be high, often based on the number of tables or data volume.
- May feel “feature-heavy” for small teams with simple needs.
Platforms / Deployment
- Web / Windows / macOS
- SaaS / Hybrid
Security & Compliance
- SSO/SAML, RBAC, Encryption at rest and in transit.
- SOC 2 Type II, GDPR, HIPAA compliant.
Integrations & Ecosystem
Monte Carlo connects seamlessly across the modern data stack to provide holistic visibility.
- Snowflake, BigQuery, Redshift, Databricks
- dbt, Airflow, Prefect
- Looker, Tableau, Power BI
- Slack, PagerDuty, Jira
Support & Community
Highly mature support with dedicated customer success managers for enterprise tiers. Extensive documentation and a strong presence in the data engineering community.
#2 — Bigeye
Short description: Bigeye is designed for high-growth data teams that need to scale their data quality efforts. It emphasizes “autothresholds” and deep data profiling to catch subtle quality issues.
Key Features
- Autometrix: Automatically suggests and sets quality metrics for every column in your data warehouse.
- Anomaly Detection: Uses time-series forecasting to identify data drifts and outliers.
- Delta Monitoring: Compares data sets across different environments (e.g., Dev vs. Prod) to ensure consistency.
- Root Cause Analysis: Provides a visual drill-down into the specific records that caused an anomaly.
- Custom Templates: Allows teams to build reusable quality checks for specific business domains.
Pros
- Deep column-level profiling that catches issues other tools might miss.
- Very intuitive user interface designed for both engineers and analysts.
Cons
- Can be resource-intensive on the data warehouse during initial profiling.
- Lineage features, while present, are sometimes less granular than specialized competitors.
Platforms / Deployment
- Web
- SaaS / Cloud
Security & Compliance
- SSO/SAML, MFA, Audit logs.
- SOC 2 compliant.
Integrations & Ecosystem
Focuses on deep connectivity with major cloud data warehouses.
- Snowflake, Google BigQuery
- Amazon Redshift
- dbt, Fivetran
- Slack, Microsoft Teams
Support & Community
Strong technical documentation and a responsive support team. Frequently publishes industry-leading research on data reliability.
#3 — Acceldata
Short description: Acceldata is a multilayered platform that goes beyond data quality to include “compute observability.” It is built for large-scale enterprises running massive data workloads on Hadoop, Snowflake, or Databricks.
Key Features
- Compute Observability: Monitors the performance and cost of the underlying data infrastructure.
- Operational Intelligence: Correlates pipeline failures with infrastructure issues (e.g., memory leaks or high CPU).
- Data Quality Circuits: Allows for “stop-the-line” automation when data quality fails a critical check.
- Cross-Platform Lineage: Supports complex environments that mix legacy Hadoop with modern cloud warehouses.
- Policy Engine: Enables automated governance and compliance checks across the entire data estate.
Pros
- The only tool that effectively bridges the gap between data quality and infrastructure performance.
- Highly scalable; designed for petabyte-scale environments.
Cons
- Complex configuration required to unlock the full potential of the platform.
- UI can be overwhelming due to the sheer volume of infrastructure and data metrics.
Platforms / Deployment
- Web / Linux
- Cloud / Self-hosted / Hybrid
Security & Compliance
- RBAC, SSO/SAML, Encryption.
- SOC 2, HIPAA, GDPR (Varies by deployment).
Integrations & Ecosystem
Offers unique support for both legacy and modern technologies.
- Hadoop/HDFS, Cloudera
- Snowflake, Databricks
- Apache Spark, Kafka
- ServiceNow, Jira
Support & Community
Enterprise-focused support with 24/7 availability for high-tier customers. Strong professional services team for implementation.
#4 — Databand (IBM)
Short description: Now part of IBM, Databand focuses heavily on the “pipeline” aspect of observability. it is particularly strong for teams using Spark and complex orchestration layers.
Key Features
- Pipeline Health Monitoring: Tracks run duration, status, and failures across different orchestrators.
- Data Impact Analysis: Shows how a failed pipeline task affects downstream datasets and reports.
- Deep Spark Integration: Provides internal visibility into Spark jobs that other tools treat as “black boxes.”
- Alerting and Remediation: Integrates with DevOps tools to trigger automated pipeline reruns.
- SLA Tracking: Monitors and alerts when data delivery exceeds the agreed-upon time window.
Pros
- Best-in-class visibility for complex, distributed computing jobs (Spark/EKS).
- Seamless integration with the broader IBM and Red Hat ecosystem.
Cons
- Less focus on “data profiling” compared to tools like Bigeye.
- Can feel like a “DevOps” tool rather than a “Data Quality” tool.
Platforms / Deployment
- Web / Linux
- Cloud / Self-hosted / Hybrid
Security & Compliance
- SSO/SAML, RBAC.
- IBM Enterprise Security Standards (ISO 27001, SOC 2).
Integrations & Ecosystem
Built for the open-source and big-data engineering stack.
- Apache Airflow, Dagster
- Apache Spark, Kubernetes
- Snowflake, Redshift
- IBM Cloud Pak for Data
Support & Community
Backed by IBM’s global support infrastructure. Excellent documentation for open-source integration.
#5 — Anodot
Short description: Anodot uses patented machine learning to provide real-time anomaly detection across data pipelines and business metrics. It is geared toward companies that need to monitor streaming data.
Key Features
- Real-time Anomaly Detection: Monitors millions of data points simultaneously with sub-minute latency.
- Autonomous Learning: No manual thresholds; the ML learns the seasonality and variance of your data automatically.
- Correlated Alerts: Group related anomalies together to show the full scope of an incident.
- Cost Monitoring: Provides visibility into cloud spend and alerts on cost spikes in real-time.
- Business Metric Mapping: Links technical data anomalies to business outcomes (e.g., drop in revenue).
Pros
- Exceptional at detecting “silent” issues in high-velocity streaming data.
- Very low false-positive rate due to advanced seasonality modeling.
Cons
- Not a full “lineage” tool; focuses more on metrics than on data structure.
- Setup requires a clear understanding of the metrics you wish to track.
Platforms / Deployment
- Web
- SaaS
Security & Compliance
- SSO/SAML, Encryption.
- SOC 2 Type II, GDPR.
Integrations & Ecosystem
Strongest in the streaming and cloud-native environment.
- Amazon Kinesis, Kafka
- Google Pub/Sub
- AWS, Azure, GCP Cost Management
- Snowflake, BigQuery
Support & Community
Responsive support team with deep expertise in time-series analysis and machine learning.
#6 — Metaplane
Short description: Metaplane is often described as the “Datadog for data.” It is optimized for speed and ease of use, making it a favorite for fast-moving startups and mid-market teams.
Key Features
- Instant Setup: Connects to your stack and begins profiling in minutes.
- Automatic Lineage: Visualizes how data moves from your production database to your BI tool.
- Slack-First Alerting: Highly optimized for Slack, allowing teams to resolve issues without leaving their chat app.
- Usage Analytics: Identifies “ghost” tables that are costing money but aren’t being used in any reports.
- Schema Change Tracking: Notifies users immediately when a column is added, deleted, or renamed.
Pros
- Extremely lightweight and fast; has the best “time-to-value” in the category.
- Pricing is transparent and accessible for smaller organizations.
Cons
- Lacks some of the “compute observability” features of Acceldata.
- Not ideal for legacy on-premise (Hadoop) environments.
Platforms / Deployment
- Web
- SaaS
Security & Compliance
- SSO/SAML, MFA.
- SOC 2 compliant.
Integrations & Ecosystem
Tight integration with the modern “MDS” (Modern Data Stack).
- Snowflake, BigQuery
- Fivetran, Airbyte
- dbt, Airflow
- Slack (Primary interface)
Support & Community
Very high customer satisfaction ratings; known for a “community-first” approach and excellent documentation.
#7 — Sifflet
Short description: Sifflet is a full-stack data observability platform that emphasizes the “data contract” and collaboration between data producers and consumers.
Key Features
- Catalog-Integrated Observability: Combines a data catalog with observability metrics in a single view.
- Data Contracts: Allows teams to define and enforce programmatic agreements on data quality.
- Predictive Monitoring: Uses AI to forecast future data trends and alert on potential breaches before they happen.
- Incidents & Workflows: Built-in ticketing and resolution tracking for large data teams.
- Multi-Cloud Support: Provides a unified view across AWS, Azure, and GCP data estates.
Pros
- The integration of catalog and observability simplifies governance.
- Strong focus on “preventative” observability through data contracts.
Cons
- The platform is broad, which can lead to a steeper learning curve for users who only want simple alerts.
- Newer entry to the market compared to giants like Monte Carlo.
Platforms / Deployment
- Web
- SaaS / Hybrid
Security & Compliance
- SSO/SAML, RBAC, Encryption.
- SOC 2, GDPR.
Integrations & Ecosystem
Broad connectivity across the modern enterprise landscape.
- Snowflake, Databricks, BigQuery
- dbt, Airflow, Dagster
- Tableau, Looker, Metabase
- Jira, Slack
Support & Community
Highly engaged support team and a growing library of “Data Quality 101” resources.
#8 — Soda
Short description: Soda provides an open-source framework (Soda Core) along with an enterprise platform (Soda Cloud). It is highly favored by developers who want “Observability as Code.”
Key Features
- SodaCL (Soda Check Language): A human-readable domain-specific language for defining data quality checks.
- Git-Integrated Workflows: Manage data quality checks in the same repository as your transformation code.
- Soda Cloud: A centralized dashboard for managing alerts, incidents, and historical quality trends.
- Self-Serve Monitoring: Allows non-technical stakeholders to create and monitor their own quality metrics.
- Anomaly Detection: Built-in ML to identify unexpected shifts in data distributions.
Pros
- The open-source core allows for deep customization and local testing.
- Perfect for teams that prioritize “DataOps” and code-centric workflows.
Cons
- Requires more technical effort to set up compared to “plug-and-play” SaaS tools.
- The distinction between Core and Cloud can be confusing for new users.
Platforms / Deployment
- CLI / Web
- Cloud / Self-hosted (Core)
Security & Compliance
- SSO/SAML, RBAC, Audit trails.
- SOC 2 Type II compliant.
Integrations & Ecosystem
Excellent for teams using Python and SQL-based pipelines.
- dbt (Native integration)
- Airflow, GitHub Actions
- Snowflake, BigQuery, Postgres
- Slack, PagerDuty
Support & Community
Vibrant open-source community and professional support for Soda Cloud customers.
#9 — Lightup
Short description: Lightup focuses on “high-scale” data quality monitoring with a specific emphasis on speed and reducing the compute cost of monitoring.
Key Features
- Push-Down Execution: Runs quality checks directly in the data warehouse to minimize data movement and cost.
- Deep Data Profiling: Automatically identifies data types, distributions, and null patterns.
- Metric-Based Observability: Focuses on monitoring KPIs and data aggregates over time.
- Incident Lifecycle Management: Tracks an issue from detection to resolution with full audit trails.
- No-Code Interface: Allows business analysts to set up complex quality checks without writing SQL.
Pros
- Highly efficient compute usage; won’t bloat your Snowflake or BigQuery bill.
- Very strong no-code capabilities for non-engineers.
Cons
- Lineage features are not as visually advanced as some “lineage-first” competitors.
- Smaller community footprint compared to Monte Carlo or Blender.
Platforms / Deployment
- Web
- SaaS / Cloud
Security & Compliance
- SSO/SAML, MFA, RBAC.
- SOC 2 compliant.
Integrations & Ecosystem
Strong focus on the cloud warehouse layer.
- Snowflake, Databricks
- Google BigQuery, Azure Synapse
- Tableau, Power BI
- Slack, Teams
Support & Community
Responsive support tiers and clear documentation for enterprise setup.
#10 — Telmai
Short description: Telmai is a “no-code” data observability platform that focuses on the “entire” data lake, not just the warehouse. It is particularly strong at handling unstructured and semi-structured data.
Key Features
- Schema-Agnostic Monitoring: Can monitor JSON, Parquet, and Avro files directly in data lakes.
- Time-Travel Analysis: Compares current data quality against historical snapshots to detect subtle drifts.
- Data Profiling at Scale: Handles billions of records without the need for manual sampling.
- KPI Monitoring: Tracks specific business metrics across multiple source systems.
- Collaborative Alerts: Allows different teams to “claim” and resolve alerts based on domain ownership.
Pros
- The best tool for organizations with large, messy data lakes (S3, GCS).
- No-code approach makes it accessible to Data Stewards and Analysts.
Cons
- Native lineage visualization is still maturing.
- Fewer integrations with “orchestration” tools compared to Databand.
Platforms / Deployment
- Web
- SaaS / Hybrid
Security & Compliance
- RBAC, SSO/SAML, PII Masking.
- SOC 2, HIPAA.
Integrations & Ecosystem
Strongest in the data lake and cloud storage ecosystem.
- AWS S3, Google Cloud Storage
- Azure Data Lake Storage
- Snowflake, Databricks
- Slack, Email, Webhooks
Support & Community
Provides high-touch onboarding and technical support for enterprise accounts.
Comparison Table (Top 10)
| Tool Name | Best For | Platform(s) Supported | Deployment | Standout Feature | Public Rating |
| Monte Carlo | End-to-End Enterprise | Web, Win, Mac | Hybrid | Global Lineage | 4.8/5 |
| Bigeye | High-Growth Teams | Web | SaaS | Autometrix Profiling | 4.7/5 |
| Acceldata | Compute + Data health | Web, Linux | Hybrid | Infrastructure Monitoring | 4.6/5 |
| Databand (IBM) | Pipeline/Spark Jobs | Web, Linux | Hybrid | Spark Deep-Visibility | 4.5/5 |
| Anodot | Real-time Streaming | Web | SaaS | Real-time ML Detection | 4.6/5 |
| Metaplane | SMB / Speed of Setup | Web | SaaS | 10-minute Deployment | 4.9/5 |
| Sifflet | Catalog + Contracts | Web | Hybrid | Integrated Data Catalog | 4.7/5 |
| Soda | DataOps / Engineers | CLI, Web | Self-hosted | SodaCL Language | 4.8/5 |
| Lightup | High-Scale / Low Cost | Web | SaaS | Push-Down Execution | 4.5/5 |
| Telmai | Data Lakes / No-Code | Web | Hybrid | Semi-structured Monitoring | 4.4/5 |
Evaluation & Scoring of Data Observability Tools
The following scoring model evaluates these tools based on weighted criteria relevant to modern technical teams.
| Tool Name | Core (25%) | Ease (15%) | Integrations (15%) | Security (10%) | Performance (10%) | Support (10%) | Value (15%) | Weighted Total |
| Monte Carlo | 10 | 8 | 10 | 9 | 8 | 9 | 6 | 8.70 |
| Bigeye | 9 | 9 | 8 | 8 | 9 | 8 | 7 | 8.30 |
| Acceldata | 10 | 5 | 9 | 9 | 10 | 8 | 7 | 8.20 |
| Databand (IBM) | 8 | 6 | 9 | 9 | 9 | 9 | 7 | 8.00 |
| Anodot | 9 | 7 | 8 | 8 | 10 | 8 | 7 | 8.15 |
| Metaplane | 7 | 10 | 9 | 8 | 8 | 9 | 9 | 8.40 |
| Sifflet | 9 | 8 | 9 | 8 | 8 | 8 | 8 | 8.35 |
| Soda | 9 | 7 | 10 | 8 | 9 | 7 | 10 | 8.55 |
| Lightup | 8 | 8 | 8 | 8 | 10 | 8 | 8 | 8.20 |
| Telmai | 8 | 9 | 7 | 9 | 8 | 8 | 8 | 8.00 |
How to Interpret These Scores:
The scoring reflects the tool’s performance in its specific category. For example, Metaplane scores a 10 in Ease of Use but a 7 in Core Depth compared to Monte Carlo. Soda scores a 10 in Value because its open-source version allows for significant utility without license fees. The “Weighted Total” provides a generalized view of the tool’s robustness in a standard enterprise environment.
Which Data Observability Software Tool Is Right for You?
Solo / Freelancer
If you are managing data for a single client or a small personal project, Soda (Core) is the best choice. It is free, open-source, and allows you to build “observability as code” into your dbt projects.
SMB
For small and mid-sized businesses that use the modern data stack (Fivetran -> Snowflake -> dbt -> Looker), Metaplane is the primary recommendation. Its speed of setup and Slack-centric approach means you won’t need a dedicated “observability engineer” to manage it.
Mid-Market
As your data volume grows and your team expands, Bigeye or Sifflet provide the balance of deep profiling and incident management needed to keep multiple stakeholders aligned.
Enterprise
For large-scale enterprises with multi-cloud environments and strict compliance needs, Monte Carlo or Acceldata are the leaders. If your infrastructure includes significant Hadoop or Spark workloads, Acceldata’s ability to monitor both compute and data quality is invaluable.
Budget vs Premium
- Budget: Soda Core (Free), Metaplane (Accessible starter tiers).
- Premium: Monte Carlo, Acceldata, IBM Databand.
Feature Depth vs Ease of Use
- Technical Depth: SideFX Houdini-style depth can be found in Acceldata and Monte Carlo.
- Ease of Use: Metaplane and Telmai offer the most intuitive “no-code” experiences.
Integrations & Scalability
- Best Integrations: Monte Carlo, Soda.
- Best Scalability: Acceldata, Lightup.
Security & Compliance Needs
Organizations in highly regulated industries (Finance, Healthcare) should prioritize tools with mature SOC 2 Type II and HIPAA certifications, specifically Monte Carlo, IBM Databand, or Adobe-style security frameworks found in top-tier SaaS platforms.
Frequently Asked Questions (FAQs)
- How do data observability tools differ from traditional data quality tools?
Traditional tools are often static and require manual rules for every check. Observability tools use machine learning to automatically learn what “normal” data looks like and alert you to unexpected changes without manual input.
- What is the typical “time to value” for these platforms?
Lightweight SaaS tools like Metaplane can start showing results in under 15 minutes. Enterprise-wide deployments involving lineage and complex simulations typically take 4 to 8 weeks to fully stabilize.
- Can these tools prevent data issues before they happen?
While primarily reactive, many modern tools now support “data contracts” and CI/CD integration. This allows them to catch potential issues in a staging environment before they reach production.
- Do these tools impact the performance of my data warehouse?
Some tools use “push-down” execution to run checks locally, which can consume compute credits. Others sample the data or only monitor metadata to keep performance impact and costs to a minimum.
- How does pricing usually work for data observability?
Pricing is often based on the number of tables being monitored, the volume of data processed, or a flat “platform fee” combined with a per-user seat cost.
- Are these tools only for Data Engineers?
No. While engineers use them for troubleshooting, data analysts and business stakeholders use them to verify that the dashboards they are looking at are powered by fresh and accurate data.
- Do I need an observability tool if I already use dbt tests?
dbt tests are excellent for “known unknowns”—things you know could go wrong. Observability tools catch “unknown unknowns”—anomalies you wouldn’t have thought to write a test for.
- Can these tools handle PII and sensitive data?
Most enterprise tools have built-in PII detection. They typically only look at metadata and statistics (like min/max/null counts) and do not store the actual sensitive data in their own systems.
- What is “Data Downtime” and how do I calculate it?
Data downtime is the period when data is missing, broken, or otherwise unusable. It is calculated by multiplying the frequency of incidents by the average time it takes to detect and resolve them.
- How do I choose between open-source and SaaS observability?
Open-source (like Soda Core) is great for developers who want total control and no licensing costs. SaaS is better for teams that want a “set it and forget it” solution with professional support and global lineage.
Conclusion
Data observability is the missing piece of the modern data stack, turning “black box” pipelines into transparent, reliable assets. Whether you choose the enterprise-wide visibility of Monte Carlo, the developer-centric approach of Soda, or the infrastructure-aware monitoring of Acceldata, the goal remains the same: reducing data downtime and increasing trust in your information.For your next step, we recommend identifying your most critical data pipeline and running a pilot with 2 of the tools from this list. Focus on how quickly they detect an intentional “bad data” injection and how clearly they explain the root cause to your team.
Find Trusted Cardiac Hospitals
Compare heart hospitals by city and services — all in one place.
Explore Hospitals